- Recognize Type I and Type II errors and their consequences.
Type I error
Let’s explore the sampling distribution of sample proportions under the null hypothesis.
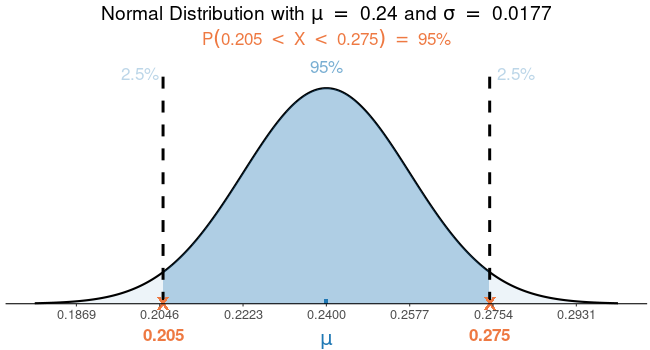
The figure illustrates our hypothesis test decision rule. If the actual sample proportion is greater than [latex]0.275[/latex] or less than [latex]0.205[/latex], we would reject the null hypothesis and conclude that there was a change in vaping rates.
But, what if the vaping rates did NOT change and you happened to select a sample proportion in the tails portion (shaded light blue) of the distribution? In other words, you selected a “lucky” sample that was simply unusual given that the null hypothesis of no change was true ([latex]0.24[/latex]), which resulted in a small enough P-value to reject the null hypothesis. In this case, you would have committed a type I error.