- Complete a chi-square test for goodness of fit and write its conclusion in context of the problem
According to the manufacturer of M&M candy, the color distribution for plain chocolate M&Ms is 13% brown, 13% red, 14% yellow, 24% blue, 20% orange, and 16% green.
This statement about the distribution of color in plain M&Ms is the null hypothesis. The alternative hypothesis says that this is not the distribution.
- [latex]H_0[/latex]: The color distribution for plain M&Ms is 13% brown, 13% red, 14% yellow, 24% blue, 20% orange, 16% green.
- [latex]H_A[/latex]: The color distribution for plain M&Ms is different from the distribution stated in the null hypothesis.
We select a random sample of 300 plain M&M candies to test these hypotheses. If the sample has the distribution of color stated in the null hypothesis, then we expect 13% of the 300 to be brown, 13% of 300 to be red, 14% of 300 to be yellow, 24% of 300 to be blue, and so on. Here are the expected counts of each color for a sample of 300 candies:
| Color | Brown | Red | Yellow | Blue | Orange | Green |
|---|---|---|---|---|---|---|
| Expected | 0.13(300)=39 | 0.13(300)=39 | 0.14(300)=42 | 0.24(300)=72 | 0.20(300)=60 | 0.16(300)=48 |
Of course, the distribution of color will vary in different samples, so we need to develop a way to measure how far a sample distribution is from the null distribution, something analogous to a z-score or T-score. Before we discuss this new measure, let’s look at two random samples selected from the null distribution to practice recognizing different amounts of variability. We can compare the distributions visually using ribbon charts.

Which random sample deviates the most from the null distribution? Use the [latex]\chi^2[/latex] Test of Goodness of Fit to find the answer.
[Trouble viewing? Click to open in a new tab.]
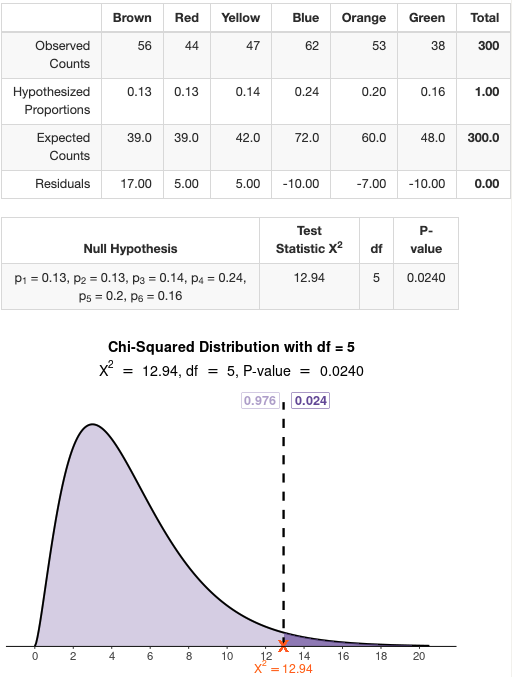
- For Sample 1, the chi-square test statistic is [latex]12.94[/latex] with a P-value of [latex]0.0240[/latex].
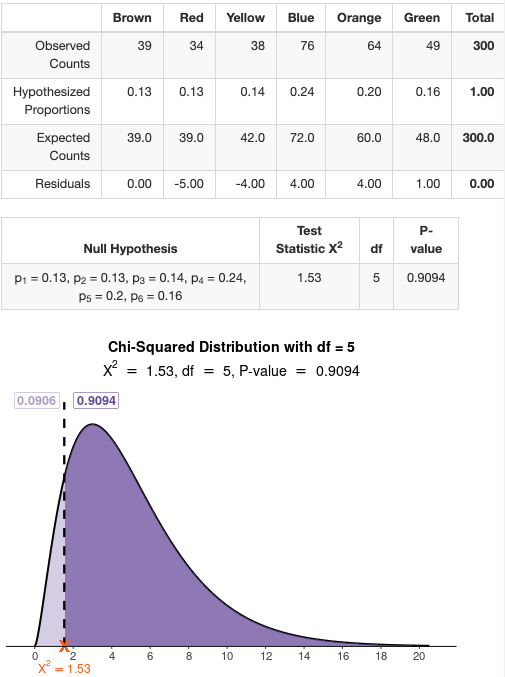
- For Sample 2, the chi-square test statistic is [latex]1.53[/latex] with a P-value of [latex]0.9094[/latex]
The chi-square goodness-of-fit test does not give information about the deviation for specific categories. It gives a more general conclusion of “seems to fit the null distribution” or “does not fit the null distribution.”
Based on the P-value on Sample 1, we have strong evidence that the color distribution for plain M&M’s differs from what is stated in the null hypothesis.
Based on the P-value on Sample 2, we do not have enough evidence to reject the claim that the color distribution for plain M&Ms differs from what is stated in the null hypothesis.
Therefore, the answer to the question: “Which random sample deviates the most from the null distribution?” is Sample # 1.