- Read and interpret a dotplot
Illustrating Frequency with Dotplots
When we conduct statistical experiments, we often work with large tables that present each individual’s information. To analyze the data, we need to summarize information and patterns about the group as a whole, not just on the individual level. A graphical display, such as a dotplot, can be useful to create such a summary.
To use a graphical display to answer questions about the data set, it helps to first ask yourself a question or two to become familiar with the visualization. This helps you understand what information this dotplot conveys about the data set. Then, we can use it to answer questions about the data.
dotplot
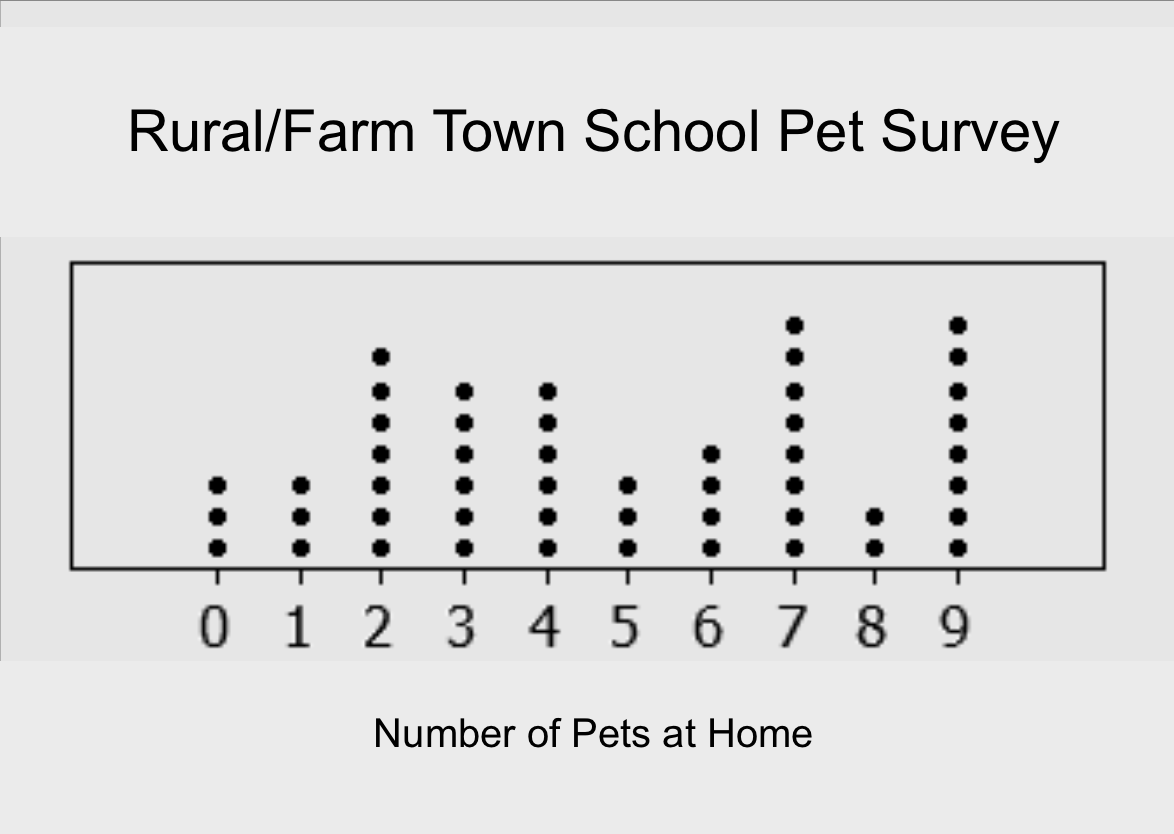
A dotplot is a simple and powerful tool to display the frequency and distribution of quantitative data.
Each dot represents a single data point that falls within a discrete bin.
Example of a dotplot:
Now that you are familiar with the information presented in the display, you can use it to answer questions about the data.
Comparing Groups with Dotplots
When we conduct statistical experiments, we often work with multiple data sets to make inferences regarding the variable of interest. Let’s look at an example where we compare different groups using dotplots as the graphical displays.