- Understand conditional probability and Bayes’ theorem
Representing Bayes’ Theorem as a tree diagram can provide a clear and intuitive visualization of how conditional probabilities work, especially in situations involving diagnostic tests.
The tree diagram breaks down complex scenarios into simpler, sequential events. This breakdown helps in understanding the flow of events and the associated probabilities at each step. Tree diagrams explicitly show the conditional relationships between events. In the context of Bayes’ Theorem, it illustrates how the probability of a specific event (having a disease) changes based on the outcome of another event (a positive test result).
Representing Bayes’ Theorem as a tree diagram simplifies the understanding of complex conditional probability relationships, making it an effective tool for both learning and problem-solving.
Consider two events [latex]A[/latex] and [latex]B[/latex] whose tree diagram is shown below.
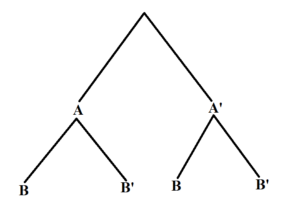
In the tree diagram, we observe that event [latex]B[/latex] is conditioned on the result of event [latex]A[/latex]. Using this tree, we can find [latex]P(B|A)[/latex] by first following the path of [latex]A[/latex] and then examining the probability for the branch that leads to event [latex]B[/latex].
In the context of a tree diagram, Bayes’ Theorem addresses conditional probabilities at the second stage. For the tree diagram above, we are interested in finding the probability of an event [latex]A[/latex] occurring given that event [latex]B[/latex] has occurred. That is, [latex]P(A|B)[/latex].
Bayes’ Theorem states that given events [latex]A[/latex] and [latex]B[/latex], then
[latex]P(A|B) = \dfrac{P(A)\times P(B|A)}{P(B)}= \dfrac{P(A)\times P(B|A)}{P(A)\times P(B|A) + P(A')\times P(B|A')}[/latex]
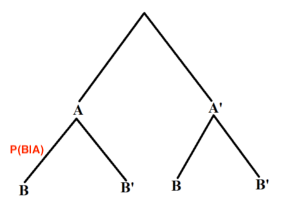
When computing Bayes’ Theorem using the probability tree, we can see that the numerator is the the path containing events [latex]A[/latex] and [latex]B[/latex]. The denominator is then the sum of all the paths that contain the event [latex]B[/latex].
Bayes’ Theorem for tree diagrams
When given two events [latex]A[/latex] and [latex]B[/latex] whose tree diagram is:
Then,
[latex]P(A|B) = \dfrac{P(\text{the path of events A and B})}{\text{ sum of } P(\text{paths containing event B})}[/latex].
Use the tree diagram to help compute the following probabilities.
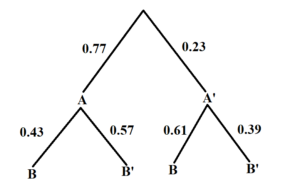
(a) [latex]P(A \text{ and } B)[/latex]
(b) [latex]P(B|A)[/latex]
(c) [latex]P(B|A')[/latex]
(d) [latex]P(A|B)[/latex]
(e) [latex]P(A'|B)[/latex]
In general, tree diagrams can can be helpful when we try and solve Bayes’ Theorem problem by giving us a way to visualize the necessary paths needed to compute a conditional probability.
Recall the example: Suppose a certain disease has an incidence rate of 0.1% (that is, it afflicts 0.1% of the population). A test has been devised to detect this disease. The test does not produce false negatives (that is, anyone who has the disease will test positive for it), but the false positive rate is 5% (that is, about 5% of people who take the test will test positive, even though they do not have the disease).
Suppose a randomly selected person takes the test and tests positive. What is the probability that this person actually has the disease?
The tree diagram associated to this scenario is as follows:
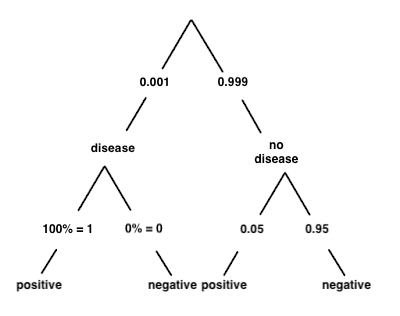
Using the formula of Bayes’ Theorem:
[latex]P(\text{disease} | \text{positive}) = \frac{P(\text{disease}) \times P(\text{positive} | \text{disease})}{P(\text{positive})} =\frac{P(\text{disease}) \times P(\text{positive} | \text{disease})}{P(\text{disease}) \times P(\text{positive} | \text{disease}) + P(\text{no disease}) \times P(\text{positive} | \text{no disease})} = \frac{(0.001)(1)}{(0.001)(1) + (0.999)(0.05)} \approx 0.0196
[/latex]
Is it easier to find the [latex]P(\text{disease} | \text{positive})[/latex] using the tree diagram rather than the prompt?