- Describe the connection between the residual and the position of a data point relative to the line of best fit.
- Create and use a residual plot to identify influential points and determine the most appropriate regression model.
- Determine the reliability of predictions from the line of best fit using the residuals and standard error of the residuals.
Residual Plots
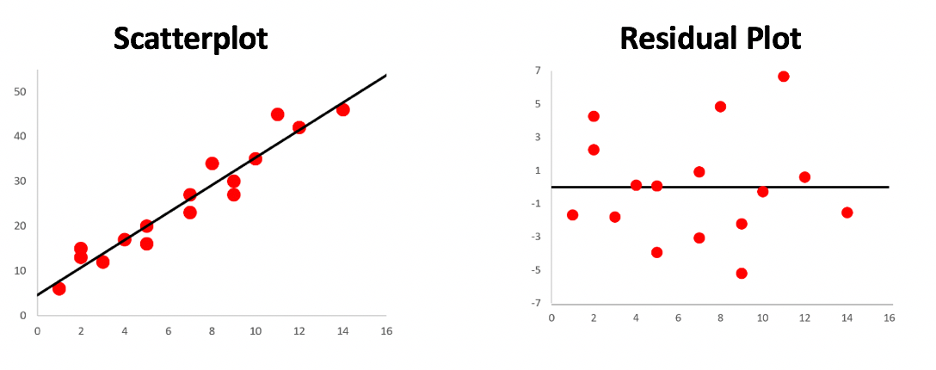
Residual plots emphasize the residual values in our model. The following scatterplot and corresponding residual plot show that our linear regression model is appropriate. The residual values appear to be randomly scattered across the x-values, with no clear patterns or changes in variability.