Calculate [latex]z[/latex]-scores to explain the location of data points.
Compare observations using [latex]z[/latex]-scores and the Empirical Rule.
The Empirical Rule
Before beginning the activity below, recall the definition of the Empirical Rule. What does it state?
The Empirical Rule states that, in a bell-shaped, unimodal distribution, almost all the observed data values, [latex]x[/latex], lie within three standard deviations, [latex]\sigma[/latex], to either side of the mean, [latex]\mu[/latex].
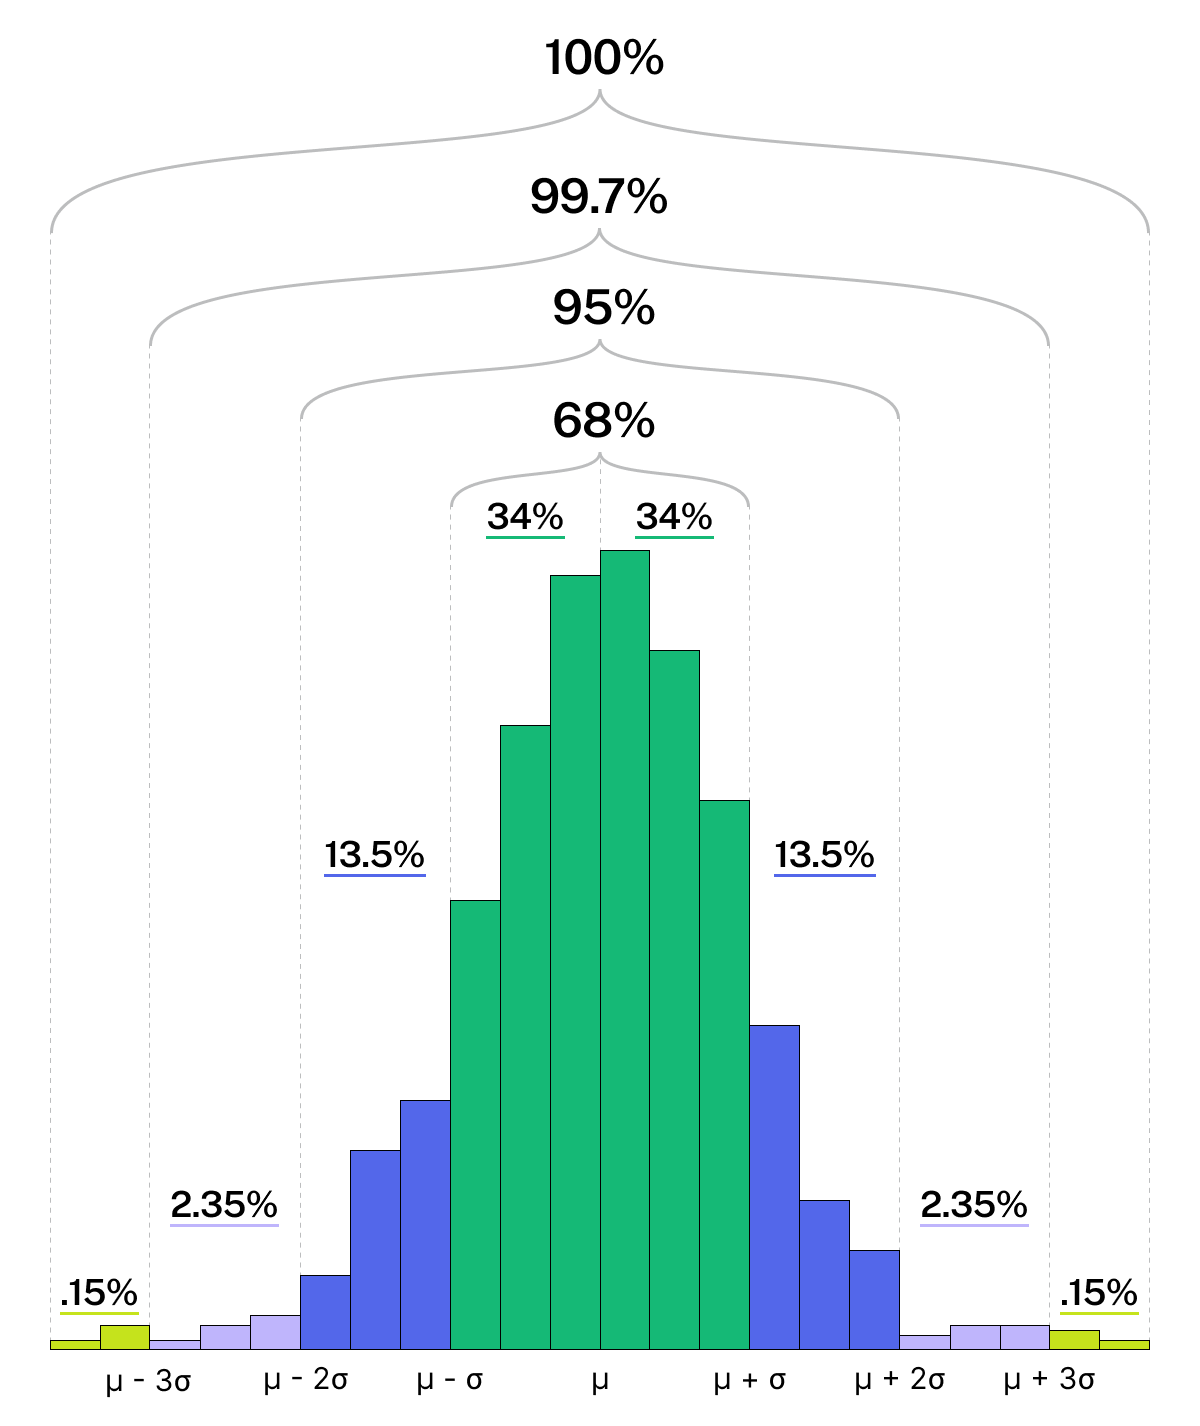
Figure 1. A normal distribution curve showing the empirical rule: about 68% of data fall within 1 standard deviation of the mean, 95% within 2, and 99.7% within 3 standard deviations.
Specifically,
[latex]68[/latex]% of the observations lie within one standard deviation of the mean. [latex]\left(\mu\pm\sigma\right)[/latex]
[latex]95[/latex]% of the observations lie within two standard deviations of the mean. [latex]\left(\mu\pm2\sigma\right)[/latex]
[latex]99.7[/latex]% of the observations lie within three standard deviations of the mean. [latex]\left(\mu\pm3\sigma\right)[/latex]
For this reason, the Empirical Rule is sometimes called the [latex]68-95-99.7[/latex] rule.
Consider the weights of the livers and spleens in [latex]26[/latex]-week-old female C57BL/6J laboratory mice. The mean liver weight is [latex]0.999[/latex] grams (g) with a standard deviation of [latex]0.087[/latex] g, and the mean spleen weight is [latex]0.086[/latex] g with a standard deviation of [latex]0.007[/latex] g.