- Calculate z-scores to explain the location of data points.
- Compare observations using z-scores and the Empirical Rule.
The Empirical Rule
If a distribution of a variable [latex]X[/latex] is bell-shaped, unimodal, and symmetric, then we can estimate how many observations are within a certain number of standard deviations.
The Empirical Rule (also known as the [latex]68-95-99.7[/latex] rule) is a guideline that predicts the percentage of observations within a certain number of standard deviations.
empirical rule
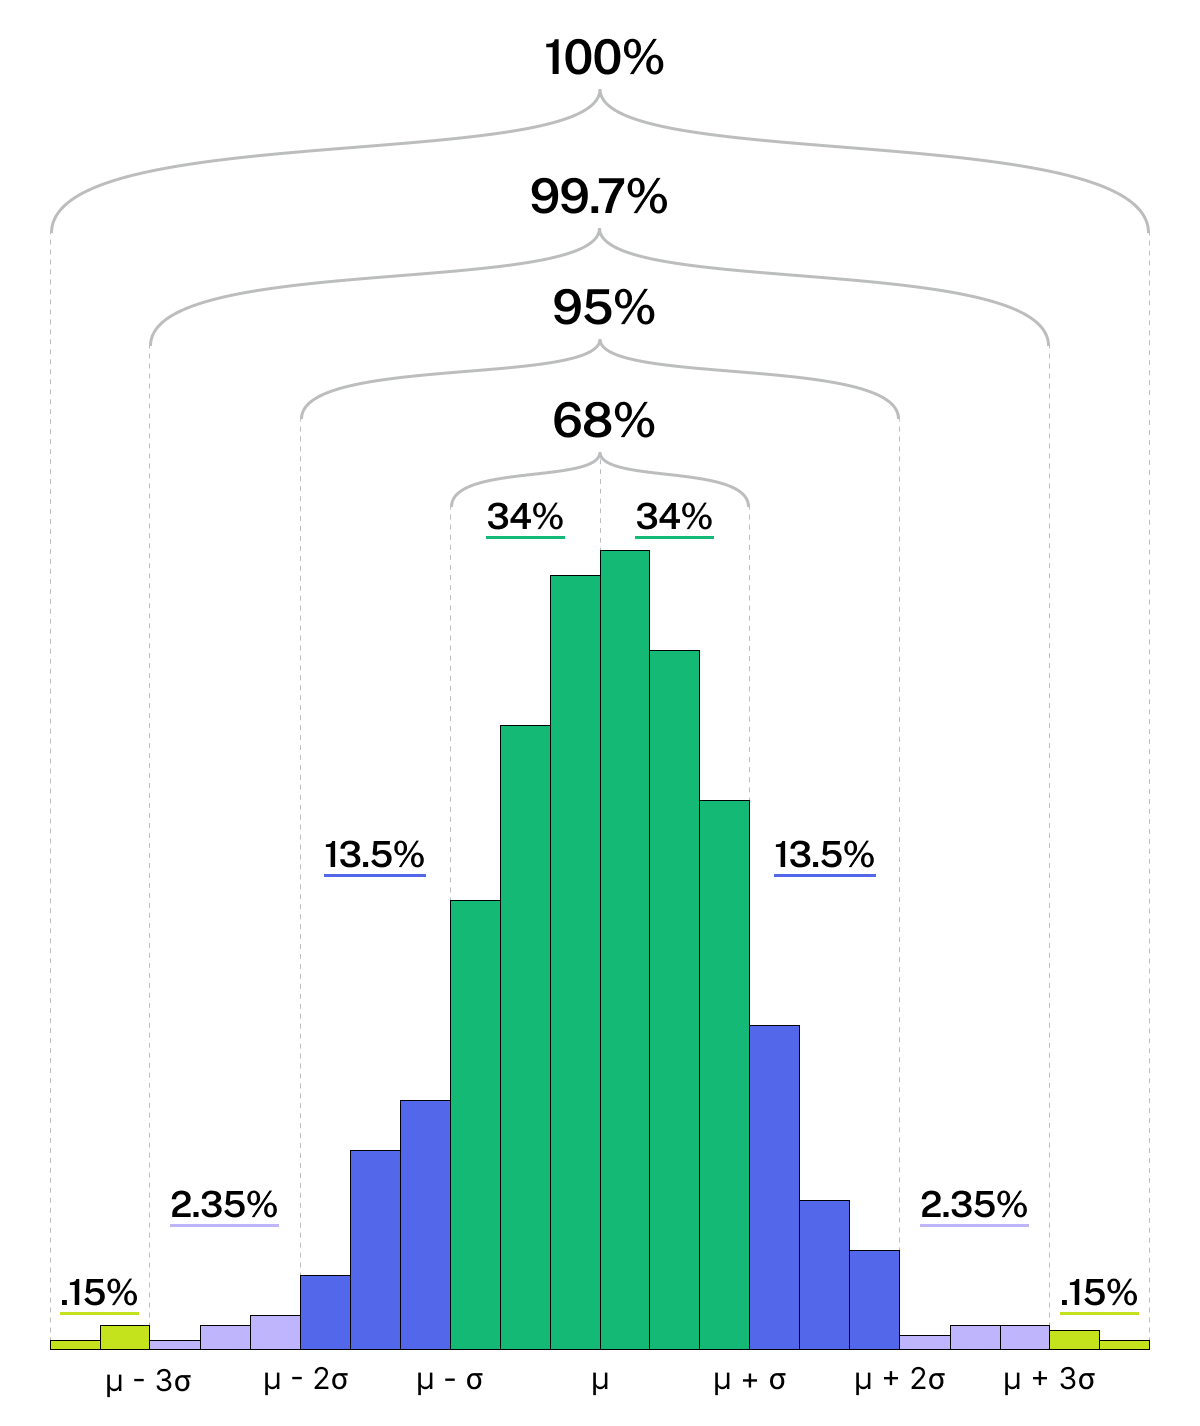
The Empirical Rule states that:
- About [latex]68\%[/latex] of observations in a data set will be within one standard deviation of the mean.
- About [latex]95\%[/latex] of the observations in a data set will be within two standard deviations of the mean.
- About [latex]99.7\%[/latex] of the observations in a data set will be within three standard deviations of the mean.
Graphically, the Empirical Rule can be expressed like this:
Now, try applying the Empirical Rule to the Movie Runtime data set.