- Read information from a boxplot and make conclusions
- Compare boxplots
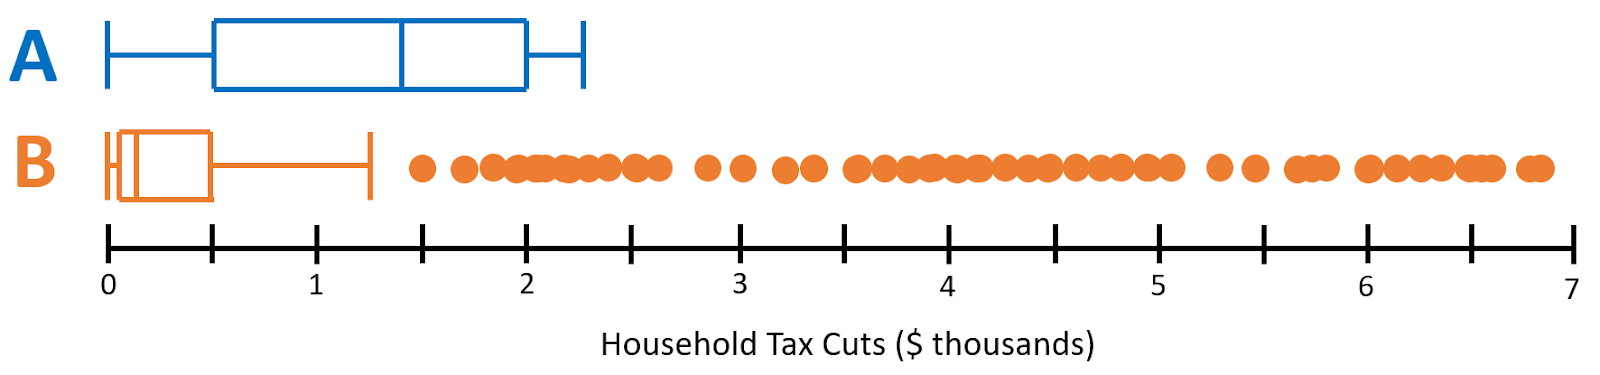
Two boxplots are provided below, each displaying a hypothetical distribution of [latex]5,000[/latex] tax cuts that would result in a mean tax cut of [latex]$1,260[/latex].
Two boxplots are provided below, each displaying a hypothetical distribution of [latex]5,000[/latex] tax cuts that would result in a mean tax cut of [latex]$1,260[/latex].