- Name the features of the distribution of a data set using statistical language
- Describe the connection between the distribution of a data set and its mean and median
Which was the best Friends episode?
Friends was a popular American television show that aired from 1994 to 2004. The show followed a group of six friends living in New York City and chronicled their relationships and day-to-day adventures. The show became known in popular culture for its comedy and for the closeness of its cast.[1]
The following table lists the number of U.S. viewers of each episode of the [latex]10[/latex]th and final season of Friends.[2]
| Episode Number | Episode Title | Air Date | U.S. Viewers (Millions) |
| 1 | The One After Joey and Rachel Kiss | 9/25/03 | [latex]24.54[/latex] |
| 2 | The One Where Ross is Fine | 10/2/03 | [latex]22.38[/latex] |
| 3 | The One with Ross’s Tan | 10/9/03 | [latex]21.87[/latex] |
| 4 | The One with the Cake | 10/23/03 | [latex]18.77[/latex] |
| 5 | The One Where Rachel’s Sister Babysits | 10/30/03 | [latex]19.37[/latex] |
| 6 | The One with Ross’s Grant | 11/6/03 | [latex]20.38[/latex] |
| 7 | The One with the Home Study | 11/13/03 | [latex]20.21[/latex] |
| 8 | The One with the Late Thanksgiving | 11/20/03 | [latex]20.66[/latex] |
| 9 | The One with the Birth Mother | 1/8/04 | [latex]25.49[/latex] |
| 10 | The One Where Chandler Gets Caught | 1/15/04 | [latex]26.68[/latex] |
| 11 | The One Where the Stripper Cries | 2/5/04 | [latex]24.91[/latex] |
| 12 | The One with Phoebe’s Wedding | 2/12/04 | [latex]25.9[/latex] |
| 13 | The One Where Joey Speaks French | 2/19/04 | [latex]24.27[/latex] |
| 14 | The One with Princess Consuela | 2/26/04 | [latex]22.83[/latex] |
| 15 | The One Where Estelle Dies | 4/22/04 | [latex]22.64[/latex] |
| 16 | The One with Rachel’s Going Away Party | 4/29/04 | [latex]24.51[/latex] |
| 17 | The Last One* | 5/6/04 | [latex]52.46[/latex] |
| 18 | The Last One* | 5/6/04 | [latex]52.46[/latex] |
*Note: the final two episodes aired back-to-back on the same night
When examining the distribution of a quantitative variable using a histogram or a dotplot, we often find that the distribution follows a bell shape with a mound of observations in the middle of the distribution and even amounts of data falling to the right and left. But sometimes a distribution’s values are bunched up to one side or the other, with a few observations stretching way out to the other side. In this section, you’ll learn that there are certain ways the mean of the data relates to the median under these different shapes.
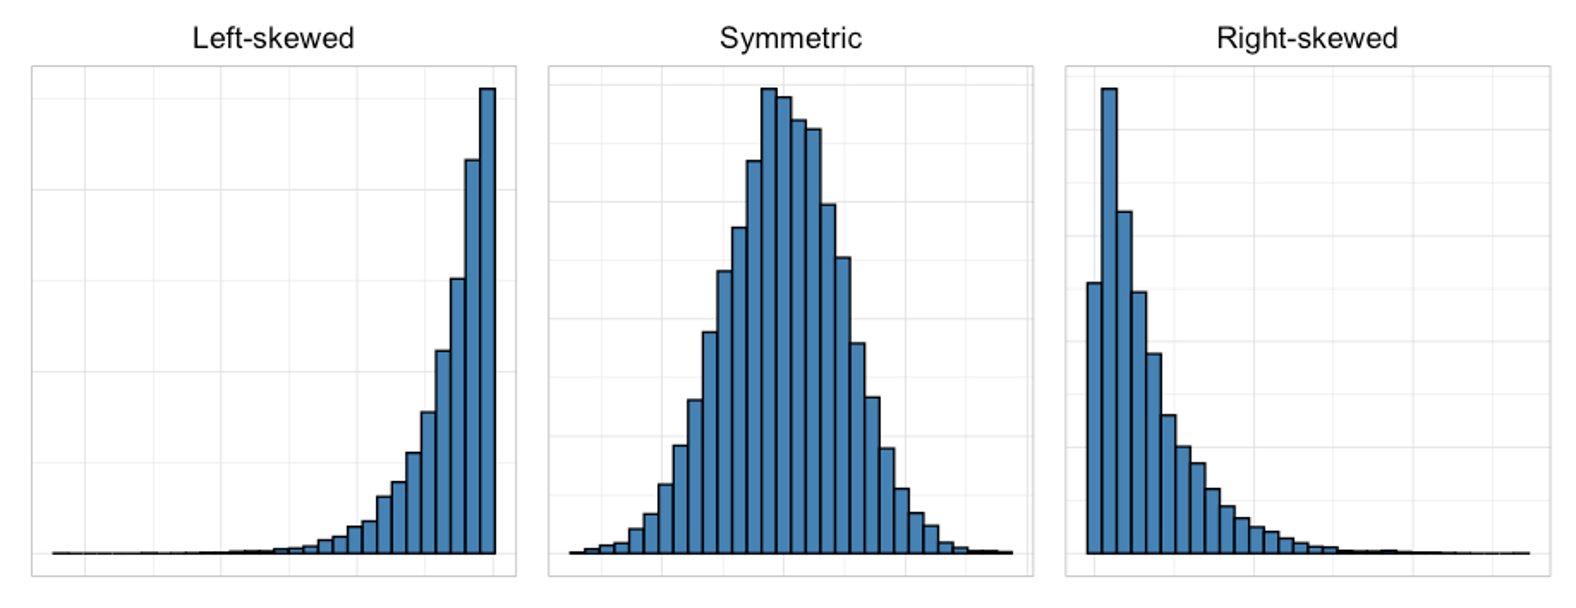
- We say a quantitative variable has a right-skewed distribution or a positive skew if there is a “tail” of infrequent values on the right (upper) end of the distribution.
- We say a data set has an approximately symmetric distribution if values are similarly distributed on either side of the mean/median.
- We say a data set has a left-skewed distribution or a negative skew if there is a “tail” of infrequent values on the left (lower) end of the distribution.
- Encyclopedia Britannica. (n.d.). Friends. In Encyclopedia Britannica.com. https://www.britannica.com/topic/Friends ↵
- Mock, T. (2020). A weekly data project aimed at the R ecosystem. TidyTuesday. https://github.com/rfordatascience/tidytuesday/blob/master/data/2020/2020-09-08/readme.md#friends_infocsv ↵