More Criteria for Effective Visualization
Efficiency
The third criterion is efficiency, which means that the effort required for the reader to understand the purpose of the graphical display is minimal. In order for a graph to be efficient, the graphical display should be clear in communicating patterns or trends.
Time, Ink, and Space
The fourth, fifth, and sixth criteria are closely related and are use of time, use of ink, and use of space. A graphical display is most effective when it allows the viewer to gain the largest number of ideas in the shortest time with the least amount of ink in the smallest space. With criteria four, five, and six, it is important not to overload the viewer of the graph with too much information. Graphical displays that do not show evidence of these criteria are graphs that have extra colors or symbols that are not needed, or 3-D plots where the third dimension is not relevant to understanding the graph.
Multivariate
The seventh criterion is multivariate, which means displaying more than one variable on a graphical display to encourage the reader to make comparisons. The way that the multivariate criterion can be shown on a graph is through the design principles of similarity, proximity, continuity, or closure.[1]
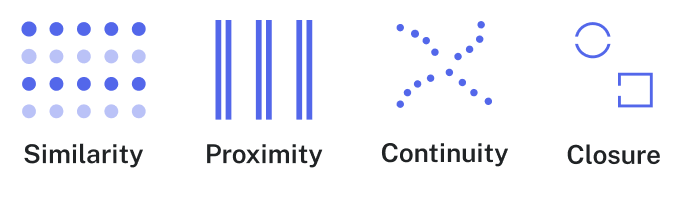
- Similarity can be shown in a graphical display through the use of similar colors or shapes.
- Proximity is defined as the spacing between visual objects.
- Connection or continuity focuses on creating visual focus for the eye using lines.
- Closure is the practice of using boxes or circles to highlight groups.
This criterion stems from the Gestalt Principles, which are a set of psychological laws that describe the tendency in the human mind to group items based on similar presentation. Graphical displays of multivariate data (more than two variables present, as opposed to univariate or bivariate data) leverage these principles to aid reader comprehension.
- Chapter 5.2: Perception. (n.d.). AllPsych. Retrieved from https://allpsych.com/psychology101/perception/ ↵