- Compare data sets by describing their shapes, centers, spreads, and outliers
Evaluating Quantitative Distributions
Let’s look again at shape, center, spread, and the presence of outliers to compare and numerically evaluate histograms.
The Main Idea
When comparing the shape of distributions, look for symmetry, right skew (a long tail to the right), left skew (a long tail to the left), and whether the graph appears unimodal, bimodal, or multimodal.
The range should be examined as well. You can find the difference between the minimum and maximum values to get the range. Make a note of any outliers well above or below the bulk of the data.
The spread of the data can be indicated by how much variability there seems to be in the dataset. Look for gaps in the distribution and graphs that appear more tightly clustered (less spread) than others (more spread). When comparing spread, take care to compare the range of the distributions. Distributions that appear similar at first may possess substantially wider or narrower ranges.
Smoking and Birth Weight
Statistical question: Does smoking during pregnancy have an impact on birth weight?
To investigate this question, doctors collected data on 189 new mothers who gave birth at a hospital in Massachusetts during the 1980s.
Here we use histograms to compare the distribution of birth weights for mothers who smoked during pregnancy with mothers who did not smoke. The table shows the number of mothers with babies in each interval of birth weights. (Left endpoints are included in the bin, so a 1,000-gram baby is in the interval 1,000–1,500 grams.)
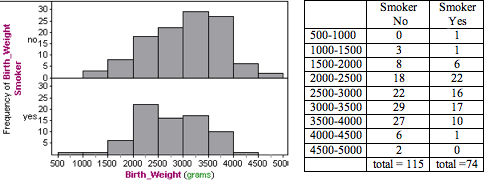
The following are some observations about the shape, center, and spread:
Nonsmokers: The distribution of birth weights for the nonsmokers appears skewed slightly to the left. We estimate that birth weights for this group fall between approximately 1,000 and 5,000 grams for an overall range of approximately 4,000 grams. For nonsmokers, nearly half of the babies have a birth weight between 3,000 and 4,000 grams (29 + 27 = 56, 56/115 = 48.7%), with fewer babies in the lower weight ranges.
Smokers: The distribution of birth weights for the smokers appears slightly skewed to the right. We estimate the birth weights for this group fall between approximately 500 and 4,500 grams for an overall range of approximately 4,000 grams. For smokers, nearly half of the babies have a birth weight between 2,000 and 3,000 grams (16 + 22 = 38, 38 / 74 = 51%), with fewer babies in heavier weight ranges.
Comment: As we have seen, the choice of bin width can affect the shape of a histogram. We also cannot make precise statements about center and spread because our sense of “typical” range is also affected by the choice of bin width.
Now we synthesize these observations into a paragraph.
In this observational study, we compared mothers who smoked during pregnancy to mothers who did not smoke during pregnancy. The variable is the birth weights of their babies. Both groups had a lot of variability in birth weights, with identical overall range estimates of 4,000 grams.
There was also a lot of overlap in the distributions. Nonsmokers had babies that weighed between approximately 1,000 and 5,000 grams. Smokers had babies that weighed between approximately 500 and 4500 grams.
However, we also observe some important differences in the typical ranges of birth weights for the two groups. For nonsmokers, nearly half of the babies have a birth weight between 3,000 and 4,000 grams (56 out of 115, 48.7%), with fewer babies in the lower weight ranges. For smokers, nearly half of the babies have a birth weight between 2,000 and 3,000 grams (40 of 74, 54%), with fewer babies in heavier weight ranges.
If we use the medical definition of low birth weight (under 2,500 grams), we see that smokers in this study have a much higher incidence of low birth weights: 25.2% (29 of 115) of the babies born to nonsmokers fit the definition of low birth weight, compared to 40.5% (30 of 74) of the babies born to smokers. In this study, smoking is associated with lower birth weights, though the variability in the data suggests that other variables also contribute to birth weight.
Sugar in Cereals
Here we use shape, center, and spread to compare the distribution of sugar content in adult cereals and children’s cereals.
Compare the shapes:

The sugar content in adult cereals is skewed to the right. Many adult cereals have less than 8 grams of sugar in a serving. A smaller number of adult cereals contain high amounts of sugar. The sugar content for children’s cereals is skewed to the left. Many children’s cereals have more than 8 grams of sugar in a serving, with a smaller number of children’s cereals with low amounts of sugar.
Compare the centers: Here, we looked at the most common value in each distribution. A typical adult cereal has 3 grams of sugar in a serving. A typical children’s cereal has 12 grams of sugar in a serving.
Compare the spreads: Adult cereals have 0 to 14 grams of sugar in a serving. Children’s cereals vary from 1 to 15 grams. So both types of cereal vary over a range of 14 grams. (Note: Overall range = highest value – lowest value. For adult cereals: 14 – 0 = 14. For children’s cereals: 15 – 1 = 14)
When comparing two distributions, we usually tie all of these ideas into one paragraph, such as:
In this sample, children’s cereals have more sugar per serving than adult cereals. A typical children’s cereal has 12 grams of sugar in a serving. It is not uncommon for children’s cereals to have 9 to 13 grams of sugar per serving, but it is unusual for a children’s cereal to have less than 8 grams of sugar. A typical adult cereal has 3 grams of sugar in a serving. It is not uncommon for adult cereals to have 0 to 6 grams of sugar in a serving. Larger amounts of sugar are less common.