- Learn how to construct and interpret a tree diagram to represent sequential events or decisions
- Calculate conditional probabilities using tree diagrams, considering both dependent and independent events
- Apply tree diagrams to solve problems involving probability of multiple events, such as probability of compound events and conditional probability
Tree Diagrams
A tree diagram is a visual tool used to show the possible outcomes of a series of events or decisions. It resembles an upside-down tree (or a sideways tree), where each branch represents a different choice or scenario, and the leaves of the tree represent the final outcomes or results. Tree diagrams are commonly used in probability theory to calculate the likelihood of different combinations of events happening. They provide a clear and organized way to understand and analyze various possibilities in a decision-making process or in random events.
tree diagrams
A tree diagram is a special type of graph used to determine the outcomes of an experiment.
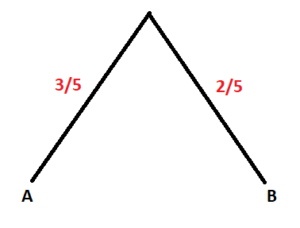
It consists of “branches” that are labeled with either frequencies or probabilities.
When creating a tree diagram, it is important to first consider the sample space of a chance experiment. Once you have correctly listed all the possible outcomes, the next step is to consider the probabilities for each of these outcomes.
Once you have this information, you can begin constructing the tree diagram by labeling the outcomes at the ends of the “branches” with their corresponding probabilities along the “branch.” It is important to note that the sum of the probabilities should equal 1 (or 100%) since these represent all the possible outcomes of the chance experiment.
(a) What is the sample space [latex]S[/latex] of the chance experiment?
(b) What is the probability of event [latex]A[/latex]?
(c) What is the probability of event [latex]B[/latex]?
(d) What does the tree diagram look like for the given chance experiment?
In some cases, there might be a situation where the experiment might have more than two outcomes in the sample space or there are multiple stages to the experiment. The result would lead to a greater number of branches for the probability tree.
In an urn, there are [latex]11[/latex] balls. Three balls are red ([latex]R[/latex]) and eight balls are blue ([latex]B[/latex]).
Experiment: Draw two balls, one at a time, with replacement.
Note: “With replacement” means that you put the first ball back in the urn before you select the second ball. The tree diagram using frequencies that show all the possible outcomes follows.

The first set of branches represents the first draw. The second set of branches represents the second draw. Each of the outcomes is distinct.
In fact, we can list each red ball as [latex]R1, R2, \text{ and } R3[/latex] and each blue ball as [latex]B1, B2, B3, B4, B5, B6, B7, \text{ and }B8[/latex].
- Show that there are 9 different outcomes when we draw a red and then a red. Note: this is the most right branch.
- List out the 24 [latex]BR[/latex] outcomes.
- How many outcomes are there in the sample space?