- Learn how to construct and interpret a tree diagram to represent sequential events or decisions
- Calculate conditional probabilities using tree diagrams, considering both dependent and independent events
- Apply tree diagrams to solve problems involving probability of multiple events, such as probability of compound events and conditional probability
Tree diagrams are particularly useful when investigating the probability of compound events. By creating a probability tree, we can visualize the sequence of events and determine the probability by multiplying the appropriate path along corresponding branches in the tree diagram. This method is beneficial when solving for two events that are either independent or dependent.
multiplication rule of probability
Tree diagrams are often used to represent sequences of independent events. Independent events are events where the outcome of one event does not affect the outcome of the other events.
If two events [latex]A[/latex] and [latex]B[/latex] are independent:
[latex]P(A \text{ and }B) = P(A) \times P(B)[/latex]
So, in a tree diagram, probabilities are multiplied along the branches to find the probability at the end of a branch due to the Multiplication Rule of Probability.
When these probabilities are multiplied, they are essentially being combined to represent the likelihood of a specific sequence of events occurring.
Note: Without replacement means that you do not put the first ball back before you select the second marble.
Following is a tree diagram for this situation.
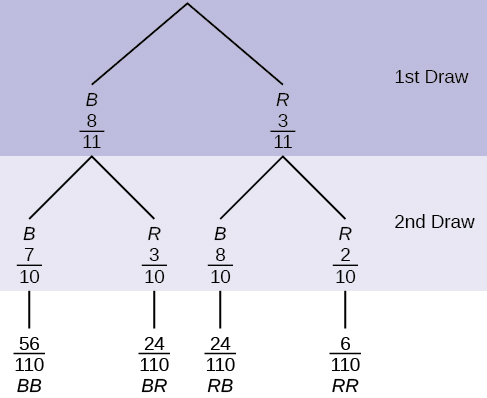
The branches are labeled with probabilities. Note: If you draw a red on the first draw from the three red possibilities, there are two red marbles left to draw on the second draw. You do not put back or replace the first marble after you have drawn it. You draw without replacement, so that on the second draw there are ten marbles left in the urn.
The numbers at the ends of the branches are calculated by multiplying the numbers on the two corresponding branches.
For example:
[latex]P(BB)=\frac{8}{11}*\frac{7}{10}=\frac{56}{110}[/latex]
Find/calculate the following probabilities using the tree diagram:
(a) [latex]P(B)[/latex]
(b) [latex]P(R \text{ on the 1st} \text{ and } B \text{ on the 2nd})[/latex]
(c) [latex]P(RB \text{ or } BR)[/latex]
(d) [latex]P(\text{2nd one is }R)[/latex]
(e) Show that the [latex]P(\text{Sample Space})[/latex] is [latex]1[/latex] or [latex]100\%[/latex].