- Describe the connection between the residual and the position of a data point relative to the line of best fit.
- Create and use a residual plot to identify influential points and determine the most appropriate regression model.
- Determine the reliability of predictions from the line of best fit using the residuals and standard error of the residuals.
Outliers
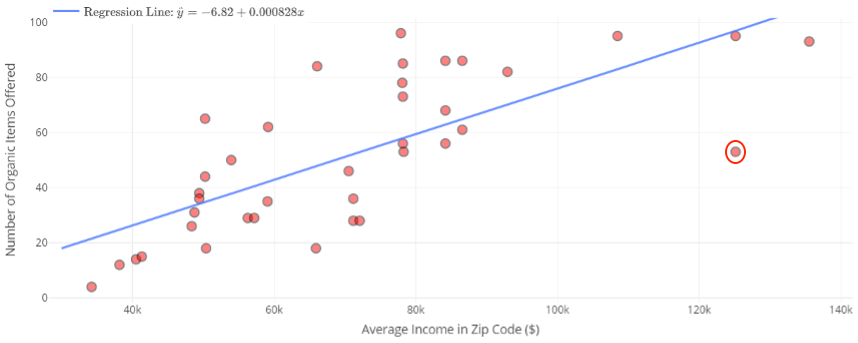
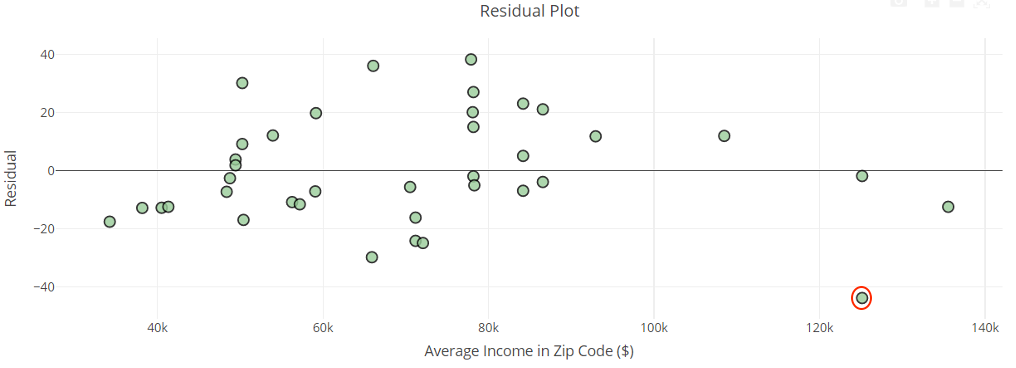
The organic items data set contained in the course web app is actually a slightly altered version of the original data set. The original data set is visualized in the following scatterplot, along with an accompanying residual plot. This original data set is identical to the data set we saw earlier, except it contains one additional data point: An outlier. The outlier is circled in both the scatterplot and the residual plot.
The Office of Disease Prevention and Health Promotion stated: “Food insecurity may be long-term or temporary. It may be influenced by a number of factors, including income, employment, race/ethnicity, and disability. The risk for food insecurity increases when money to buy food is limited or not available.
Racial and ethnic disparities exist related to food insecurity. In 2020, Black non-Hispanic households were over [latex]2[/latex] times more likely to be food insecure than the national average ([latex]21.7[/latex] percent versus [latex]10.5[/latex] percent, respectively). Among Hispanic households, the prevalence of food insecurity was [latex]17.2[/latex] percent compared to the national average of [latex]10.5[/latex] percent. Potential factors influencing these disparities may include neighborhood conditions, physical access to food, and lack of transportation.
Food assistance programs, such as the National School Lunch Program (NSLP); the Women, Infants, and Children (WIC) program; and the Supplemental Nutrition Assistance Program (SNAP), address barriers to accessing healthy food. Studies show these programs may reduce food insecurity. More research is needed to understand food insecurity and its influence on health outcomes and disparities. Future studies should consider characteristics of communities and households that influence food insecurity. This additional evidence will facilitate public health efforts to address food insecurity as a social determinant of health.” [1]
- https://health.gov/healthypeople/priority-areas/social-determinants-health/literature-summaries/food-insecurity ↵