- Describe how the slope, shape of the data, and the coefficient of determination are connected.
- Find [latex]R^2[/latex] and describe how [latex]R^2[/latex] describes the relationship in a data set.
Decimals and Percentages
The variable [latex]R^2[/latex] is the square of the correlation coefficient, but is usually stated as a percent, rather than in decimal form. Depending on the tools you use, [latex]R^2[/latex] may be expressed as a decimal or as a percentage. Even though the tool expresses [latex]R^2[/latex] as a percentage, it is important to be able to convert between the two forms.
(b) Convert [latex]67\%[/latex] to a decimal.
Squaring Numbers
Since the coefficient of determination is equal to the square of the correlation coefficient, we will examine the operation of squaring. Squaring a number is the same as multiplying that number by itself.
Do you suppose it may be true that squaring a number always yields a larger number as in the examples above? Let’s explore that idea by trying to find an example in which squaring a number yields either a smaller or the same number in return.
A counterexample is an example that contradicts or disproves a general statement. For instance, suppose someone proposes the following general statement: “All people like ice cream”. A counterexample to this statement would be someone who doesn’t like ice cream. It only takes one counterexample to show that a statement is false.
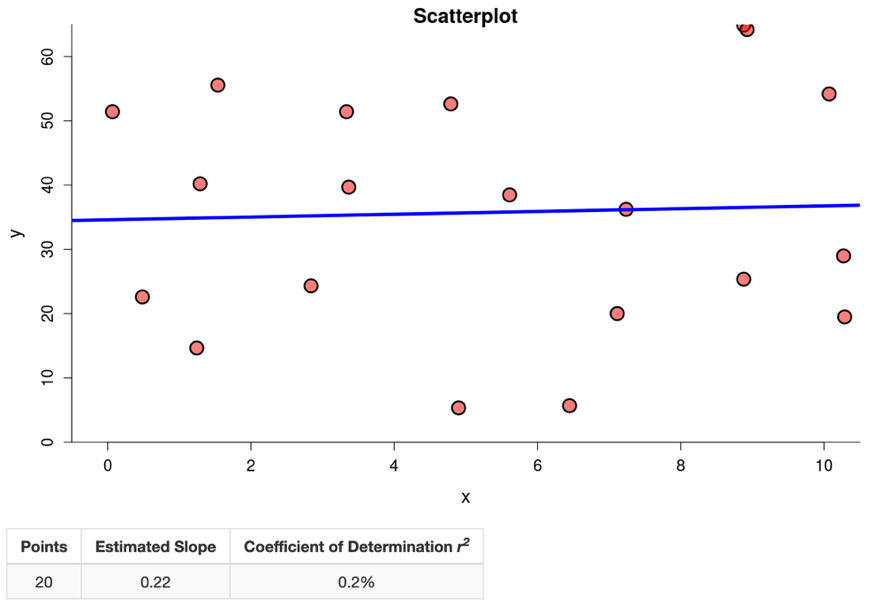
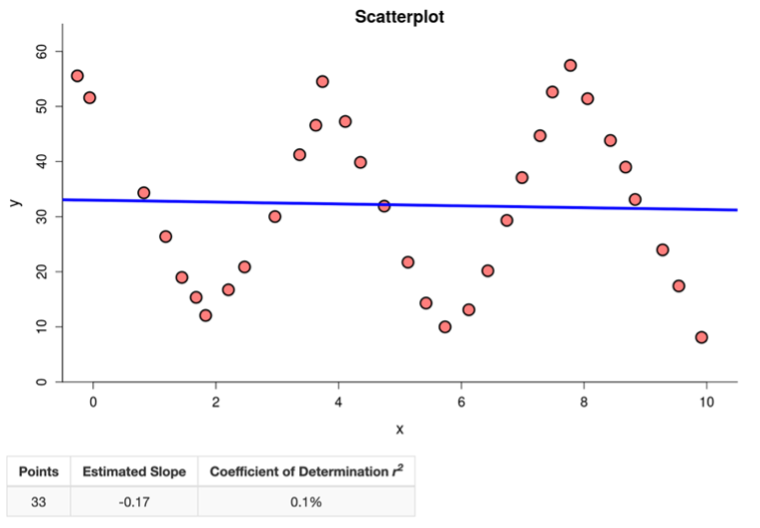
Values of the Coefficient of Determination, [latex]R^{2}[/latex]
Step 1: From the drop-down menu Initial Relationship, select Draw Your Own (Click in Graph).
Step 2: Check the boxes for Linear Regression Line, Show Correlation Coefficient [latex]r[/latex], and Squared Correlation Coefficient [latex]r^{2}[/latex].
[Trouble viewing? Click to open in a new tab.]
Correlation Coefficient ([latex]r[/latex]) vs. Coefficient of Determination ([latex]R^{2}[/latex])
The variable [latex]R^2[/latex] is called the coefficient of determination and is the square of the correlation coefficient, but is usually stated as a percent, rather than in decimal form.
Let’s Summarize
When the form of a relationship is linear, we use the correlation coefficient, [latex]r[/latex], to measure the strength and direction of the linear relationship. The correlation coefficient, [latex]r[/latex], ranges between [latex]−1[/latex] and [latex]1[/latex]. The square of the correlation, [latex]R^2[/latex], is the coefficient of determination. [latex]R^2[/latex] is the proportion of the variation in the response variable that is explained by the least-squares regression line. The coefficient of determination ranges between [latex]0\%[/latex] and [latex]100\%[/latex].