Find and explain the slope and y-intercept of a linear model.
Linear Equation
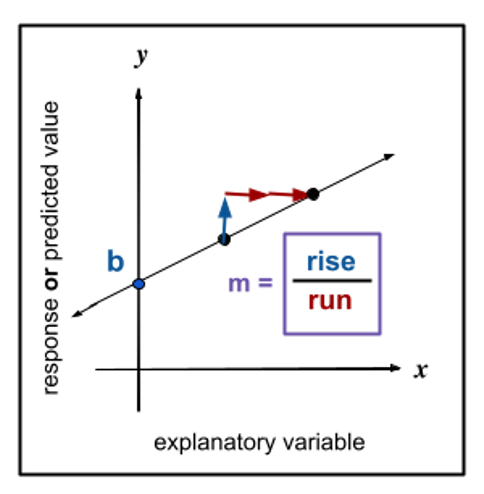
The general form of a linear equation: [latex]y=mx+b[/latex], where [latex]m[/latex] is the slope of the line and [latex]b[/latex] is the [latex]y[/latex]-intercept.
[latex]x[/latex] is the explanatory (independent) variable.
[latex]y[/latex] is the response (dependent) variable, the focus of the study.
The slope, [latex]m[/latex], is the ratio that measures how much [latex]y[/latex] changes compared to an increase in [latex]x[/latex].
[latex]\displaystyle m=\frac{{{y}_{2}}-{{y}_{1}}}{{{x}_{2}}-{{x}_{1}}}[/latex] where [latex]m=\text{slope}[/latex] and [latex]\displaystyle ({{x}_{1}},{{y}_{1}})[/latex] and [latex]\displaystyle ({{x}_{2}},{{y}_{2}})[/latex] are two points on the line.
The [latex]y[/latex]-intercept, [latex]b[/latex], is the place on the graph where the line crosses the [latex]y[/latex]-axis.
Figure 1. Graph showing how to calculate the slope of a line using two points: slope is the ratio of the vertical change (rise) to the horizontal change (run).Figure 2. An alternate graph showing how to calculate the slope of a line using two points: slope is the ratio of the vertical change (rise) to the horizontal change (run).