 Welcome, students!
Here, you’ll find links to resources to support your learning in this course, including links to our Statistical Technology Tools – these tools are available in the learning content when you’ll need them, but you can always access them here for other assignments.
JUMP TO: Cheat Sheets | Guided Notes | Get Stronger Practice Pages |
Statistical Technology Tools | Data Set Files | Meet Our Instructors
——————————————————
Cheat Sheets
These quick-reference notes bring together the most important takeaways from each module in one place. Each cheat sheet highlights essential concepts and provides a glossary of key terms. They’re designed to make studying more efficient by giving you a condensed version of the material so you can review with confidence.
Module 1 Cheat Sheet: Thinking Statistically and Collecting Data
Module 2 Cheat Sheet: Statistical Studies
Module 3 Cheat Sheet: Describing Data Graphically
Module 4 Cheat Sheet: Describing Data Numerically
Module 5 Cheat Sheet: Modeling and Analysis of Bivariate Data
Module 6 Cheat Sheet: Probability
Module 7 Cheat Sheet: The Normal Distribution
Module 8 Cheat Sheet: Introduction to Sampling Distributions
Module 9 Cheat Sheet: Confidence Intervals for Population Proportions
Module 10 Cheat Sheet: Hypothesis Testing for a Population Proportions
Module 11 Cheat Sheet: Confidence Intervals for Population Means
Module 12 Cheat Sheet: Hypothesis Testing for Population Means
Module 13 Cheat Sheet: Analysis of Variance
Module 14 Cheat Sheet: Chi-Square Statistics
Module 15 Cheat Sheet: Inferences Concerning Regression Models
Module 16 Cheat Sheet: Multiple Linear Regression
Module 17 Cheat Sheet: Bootstrap and Simulation-Based Statistics
Module 18 Cheat Sheet: Additional Concepts in Probability
Module 19 Cheat Sheet: Additional Concepts in Probability Distributions
Guided Notes
These notes are designed to help you follow along with the material if you find that helpful. Use them as you listen to a class lecture or as you make your way through the Study Plan. You’re welcome to print these guided notes, modify them, or skim them while studying – it’s entirely up to you. They’re not about taking perfect notes or completing an assignment to turn in. They will help you process and remember information so that you can later apply your knowledge and build on it.
Module 1 Guided Notes: Thinking Statistically and Collecting Data
Module 2 Guided Notes: Statistical Studies
Module 3 Guided Notes: Describing Data Graphically
Module 4 Guided Notes: Describing Data Numerically
Module 5 Guided Notes: Modeling and Analysis of Bivariate Data
Module 6 Guided Notes: Probability
Module 7 Guided Notes: The Normal Distribution
Module 8 Guided Notes: Introduction to Sampling Distributions
Module 9 Guided Notes: Confidence Intervals for Population Proportions
Module 10 Guided Notes: Hypothesis Testing for a Population Proportions
Module 11 Guided Notes: Confidence Intervals for Population Means
Module 12 Guided Notes: Hypothesis Testing for Population Means
Module 13 Guided Notes: Analysis of Variance
Module 14 Guided Notes: Chi-Square Statistics
Module 15 Guided Notes: Inferences Concerning Regression Models
Module 16 Guided Notes: Multiple Linear Regression
Module 17 Guided Notes: Bootstrap and Simulation-Based Statistics
Module 18 Guided Notes: Additional Concepts in Probability
Module 19 Guided Notes: Additional Concepts in Probability Distributions
Get Stronger: Practice Pages
Additional practice problems that help develop a deeper understanding of the concepts in the Learn It and Apply It.
Module 1
Module 2
- Experimental Design
- Observational Studies
- Advanced Experimental Design
- Complex Graphical Displays
- Effective Visualizations
Module 3
- Displaying Categorical Data
- Applications of Bar Graphs
- Visualizing Quantitative Data
- Distribution of Quantitative Variables
- Comparing Quantitative Distributions
Module 4
- Measures of Center
- Interpreting the Mean and Median
- Boxplot Data and Displays
- Measures of Variability
- Z-Score and the Empirical Rule
Module 5
Module 6
Module 7
Module 8
Module 9
- Confidence Interval for Proportions
- Confidence Interval for Proportions (continued)
- Sample Size for Proportions
- Confidence Intervals for the Difference in Population Proportions
Module 10
- Null and Alternative Hypotheses
- Test Statistics
- P-Value
- One-Sample Hypothesis Test for Proportions
- Errors in Hypothesis Testing
- Two-Sample Test for Proportions
- Connecting Tests and Intervals
Module 11
- Sampling Distribution of a Sample Mean
- t-distribution
- Confidence Interval for Population Mean
- Confidence Interval for Difference in Population Means
Module 12
Null and Alternative Hypothesis for Means
One-Sample Hypothesis Test for Means
Comparing Two Population Means (Independent Samples)
Comparing Two Population Means (Dependent Samples)
Module 13
Introduction to One-Way ANOVA
Conditions for ANOVA
ANOVA
Pair-wise Comparisons for ANOVA
Module 14
Introduction to Chi-Square Statistics
Chi-Square Test for Goodness of Fit
Chi-Square Test of Homogeneity
Chi-Square Test of Independence
Fisher’s Exact Test
Module 15
Test for Significance of Slope
ANOVA for Regression
Confidence Interval and Prediction Interval
Transforming Data
Module 16
Multiple Linear Regression
Indicator Variable
Interaction Terms
Module 17
Bootstrap Distribution and Confidence Interval for a Population Mean
Bootstrap Confidence Interval
Simulation-Based Hypothesis Test for a Population Proportion
Simulation-Based Hypothesis Test for a Difference in Proportions
Module 18
Module 19
Discrete Probability Distributions
Binomial Distribution
Connection Between Binomial and Normal Distributions
Additional Practice:
Statistical Technology Tools
These tools are linked throughout the course so you can solve problems and visualize data in different ways. You can access each tool directly via the links below.
| Tool Name | Description |
| Obtain the ANOVA table, F-statistic and side-by-side boxplots to check assumptions. Carry out pairwise comparisons, including simultaneous confidence intervals for pairwise differences of means. | |
| Construct 2 x 2 contingency tables, obtain conditional proportions, and get a bar graph. Find the difference or ratio of proportions to describe the strength of the association. Build the sampling distribution of the difference or ratio via resampling. | |
| Confidence intervals or hypothesis tests about the difference of two population means. Enter your own data or summary statistics. Visualize the interval or the P-value on a graph. For two independent or two dependent samples. | |
| Confidence intervals or hypothesis tests about the difference of two population proportions. Obtain the margin of error or the z-test statistic and visualize the interval or the P-value on a graph. For two independent or two dependent samples. | |
| Randomly generate scatterplots to guess the correlation coefficient r. Optionally, display the regression line. See how your guesses correlate with the actual values. | |
| Construct frequency and contingency tables and bar graphs to explore distributions of categorical variables. For one or two categorical variables. | |
| Find summary statistics and construct interactive histograms, boxplots, dotplots, or stem-and leaf plots. For one, two, or more groups. | |
| Visualize and explore relationships between Type I and Type II errors and the power of a test for proportions or means. See how they depend on sample size and the true values of population parameters. | |
| What does “95% confidence” mean? What affects the width of an interval? Explore these concepts for confidence intervals of proportions or means, using sliders to change parameters or the sample size. | |
| Create scatterplots from scratch by clicking in an empty plot to add or remove points. Investigate the effect of outliers on the correlation coefficient or regression line. Simulate linear or non-linear relationships. | |
| Plot a simple time series and add a smooth or linear trend. Use preloaded data or provide your own. | |
| Construct interactive scatterplots to explore the relationship between two quantitative variables while accounting for a third (categorical or quantitative) grouping variable. Fit bivariate multiple linear regression models. | |
| Visualize and run Fisher’s exact test for 2 x 2 contingency tables. Obtain the exact P-value for one- or two-sided tests. | |
| Generate random numbers or flips of a (biased) coin. Keep track of generated numbers with a bar chart. | |
| Find confidence intervals or test hypotheses about a population mean. Enter your own data or summary statistics. Use plots to check assumptions and visualize the interval or the P-value on a graph. | |
| Find confidence intervals or test hypotheses about a population proportion. Obtain the margin of error or the z-test statistic and visualize the interval or the P-value on a graph. | |
| Fit a simple linear regression model and obtain the regression equation and related statistics such as r-squared. Make predictions and construct confidence intervals. Display and analyze residuals. | |
| Explore the relationship between the mean and median for data derived from a variety of distributions or enter your own data. | |
| Construct interactive scatterplots, hover over points, move or remove points, and overlay a smooth trend line. Find the correlation coefficient r and see if it is robust to outliers. Build the sampling distribution of r via resampling. | |
| Experience how the sampling distribution of the sample proportion builds up one sample at a time. Use sliders to explore the shape of the sampling distribution as the sample size n increases or as the population proportion p changes. Overlay a normal distribution to explore the central limit theorem. | |
| Experience how the sampling distribution of the sample mean builds up one sample at a time. Use a variety of real or theoretical continuous population distributions (or create your own) from which to draw samples. Use sliders to gain a deeper understanding of the central limit theorem. | |
| Experience how the sampling distribution of the sample mean builds up one sample at a time. Use a variety of real or theoretical discrete population distributions (or create your own) from which to draw samples. Use sliders to gain a deeper understanding of the central limit theorem. | |
| Explore how the shape of the binomial distribution depends on the parameter n (the sample size) and p (the probability of success in a Bernoulli trial). Find and visualize probabilities of various kinds. | |
| See how the shape of the chi-squared distribution depends on the degrees of freedom. Find and visualize probabilities and percentiles (critical values). | |
| Test for independence, homogeneity, or goodness of fit in contingency tables. Enter your own data as raw observations or as a contingency table. Obtain observed and expected counts, and find residuals. | |
| See how the shape of the F distribution depends on the degrees of freedom. Find and visualize probabilities and percentiles (critical values). | |
| See how the shape of the normal distribution depends on the mean and standard deviation. Find and visualize one- and two-tailed probabilities and percentiles (critical values). | |
| Explore how the shape of the Poisson distribution depends on the parameter λ (the mean). Find and visualize various kinds of probabilities. | |
| See how the shape of the t distribution depends on the degrees of freedom. Find and visualize one- and two-tailed probabilities and percentiles (critical values). |
Data Sets
These data sets appear throughout the course and sometimes are easier to work with as csv or excel files. They appear in alphabetical order but the associated modules are also listed.
| Data Set | Modules |
| X | |
| 6 | |
| X | |
| X | |
| X | |
| 13 | |
| 13 | |
| 5 | |
| 5 | |
| 5 | |
| 5 | |
| 3 | |
| 3 | |
| 3 | |
| 13 | |
| 12 | |
| Yawn | 10 |
| School Diversity | 9 |
| Reading Level | 12 |
| X | |
| X | |
| X | |
| X | |
| X | |
| X | |
| X |
Worked Example Videos
 These three amazing instructors have recorded detailed solutions for embedded practice questions in their own style and voice. This gives you the ability to learn from an instructor who explains things in a way you just “get”, or feel free to watch all three for a deeper understanding from multiple perspectives.
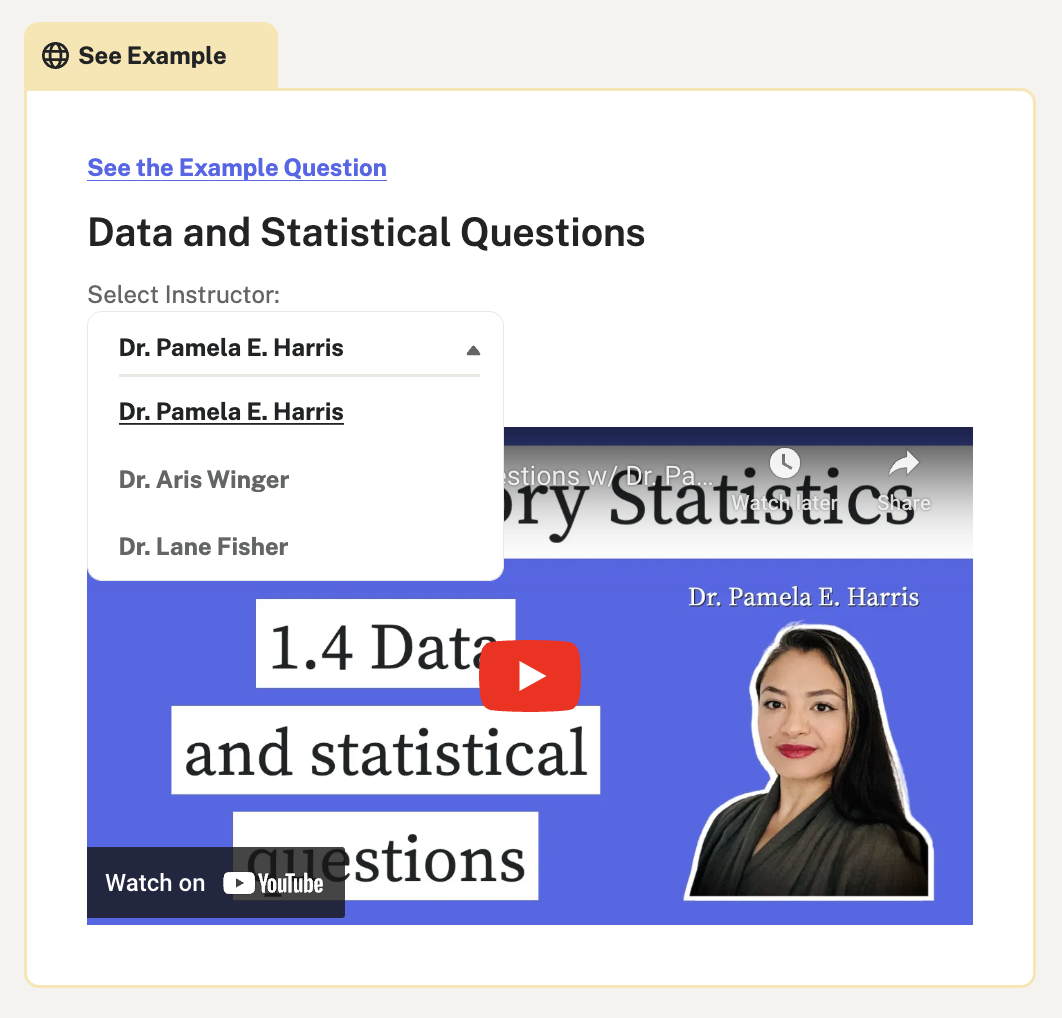
When you see a box that says “See Example” and “Select Instructor”, click on the dropdown menu next to “Select Instructor” and choose the instructor you’d like to watch. Then click the red box with the white arrow to play the video!
Meet the Instructors: