- Check the conditions for creating a confidence interval for population proportion.
- Describe the connection between the confidence level and the confidence interval.
- Calculate a confidence interval for a population proportion.
Confidence Interval for a Population Proportion
A confidence interval for a population proportion is a reasonable range of values in which we expect the population proportion to fall, given a chosen degree of confidence.
We create confidence intervals because, as previously seen, sample proportions vary from sample to sample.
A sample proportion will most likely not be equal to the true population parameter. Thus, we will use a range of values to estimate our parameter instead of simply using a single value or point estimate. Confidence intervals take sampling variability into account and convey information on estimate accuracy.
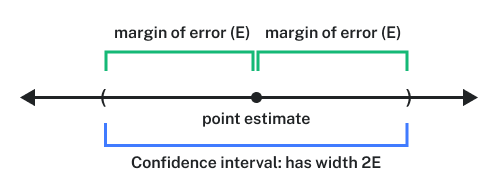
A confidence interval is calculated using the point estimate and the margin of error.
The margin of error (ME) is what determines the width of the interval. A confidence interval will have a width of twice the margin of error.
The following is a visualization of a confidence interval.
The margin of error is calculated using the standard error and the [latex]z[/latex] critical value for the confidence level. This means that the width of our interval is determined by how much our sample data varies and how confident we want to be in our method.
confidence level
The confidence level, [latex]C[/latex], tells us how much confidence we have in the method used to construct the interval. It corresponds to the percentage of all intervals we would expect to contain the true population parameter.
For example, if we have a [latex]95\%[/latex] confidence level and we took a very large number of different samples and created confidence intervals for each one, we would expect about [latex]95\%[/latex] of them to contain the population parameter.
For proportions, each confidence level has a corresponding [latex]z[/latex] critical value ([latex]z^{*}[/latex]).
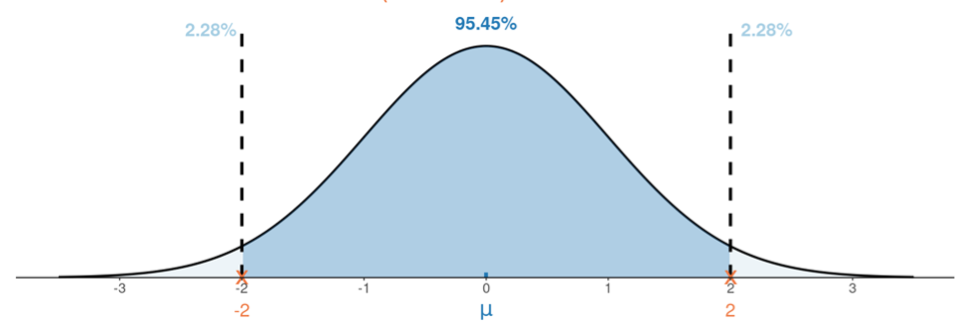
In the Empirical Rule, approximately [latex]95\%[/latex] of the data falls within [latex]2[/latex] standard deviation of the mean, which indicates [latex]z^{*}= 2[/latex] and its negative counterpart, [latex]-2[/latex].
If we look at the normal curve, as you can see below, the values of [latex]2[/latex] separate the middle [latex]95.45\%[/latex] from the most extreme [latex]4.55\%[/latex] areas. Note that the most extreme area is split evenly in each tail.
In practice, we are usually interested in [latex]90\%[/latex], [latex]95\%[/latex], and [latex]99\%[/latex] confidence intervals. Below is the standard normal distribution displaying the [latex]z[/latex] critical value, [latex]z^{*}[/latex], for a [latex]95\%[/latex] confidence level. As you can see, [latex]95\%[/latex] of the curve is shaded in and the remaining [latex]5\%[/latex] of the curve is unshaded in the tails. The values that separate the middle [latex]95\%[/latex] from the most extreme [latex]5\%[/latex] are what we will use for our confidence interval.
the [latex]z[/latex] critical value: [latex]z^{*}[/latex]
This is the point on the standard normal distribution such that the proportion of area under the curve between [latex]-z^{*}[/latex] and [latex]+z^{*}[/latex] is [latex]C[/latex], the confidence level.