- Check the conditions for creating a confidence interval for population proportion.
- Describe the connection between the confidence level and the confidence interval.
- Calculate a confidence interval for a population proportion.
During an election year, we might hear some news that state confidence intervals in terms of proportions or percentages.
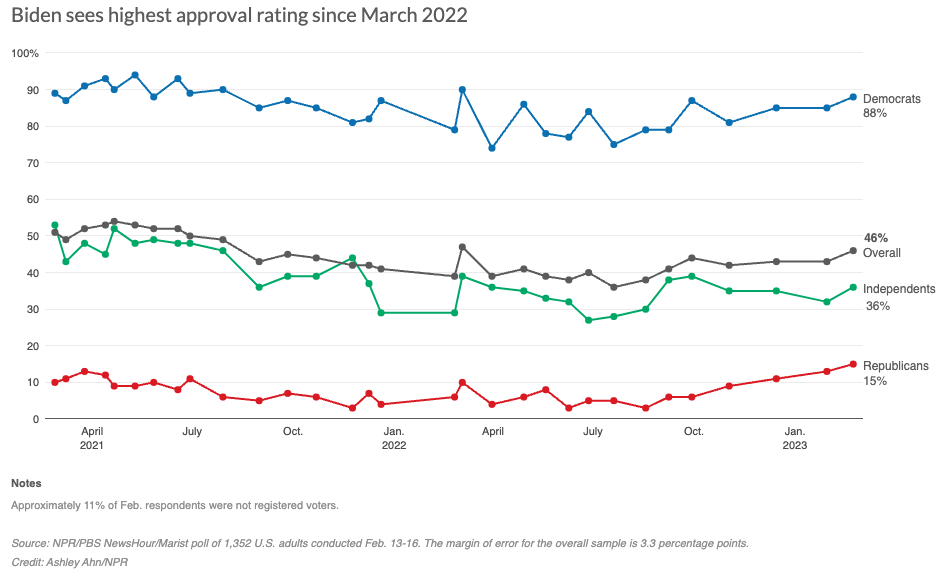
Did you notice the fine print?
[latex]46\%[/latex] is not the true population proportion, but it is a point estimate. This is the reason why they also reported the margin of error for the overall sample.
Often, we will not know the true population parameter, so we will need to estimate it. The sample proportion is used as a point estimate of the population proportion.
point estimate
A point estimate is a single value based on representative sample data that is a plausible estimate of the population parameter.
In terms of proportion, the best estimate for the population proportion, [latex]p[/latex], is the sample proportion.
We refer to the point estimate for proportions as [latex]\hat{p}[/latex].
- https://www.npr.org/2023/02/22/1158538798/poll-bidens-standing-improves-while-trump-slumps-with-republican-voters ↵