- Understand the properties, characteristics, and importance of a normal distribution in statistical analysis.
- Explain how changing the mean and standard deviation will change the characteristics of a normal curve.
Normal Curve
There are many normal curves. Even though all normal curves have the same bell shape, they vary in their center and spread.
The standard deviation, [latex]\sigma[/latex] (pronounced “sigma”), is often referred to as the scale parameter.
The shape of a normal curve will still be bell-shaped and unimodal, but the standard deviation will change how spread out or flat the curve appears.
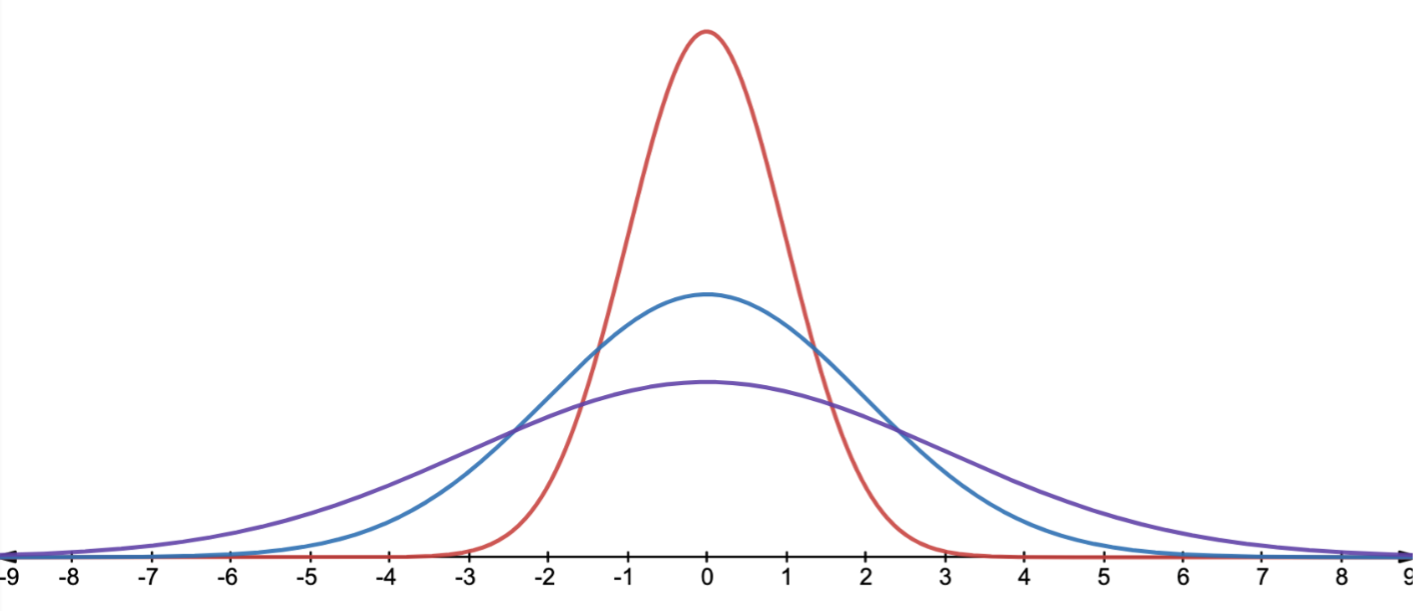
Let’s explore the normal curve by changing its mean ([latex]\mu[/latex]) and its standard deviation ([latex]\sigma[/latex]).