- Understand the concept of a probability distribution and its role in describing the behavior of a random variable.
- Describe the characteristics of probability distributions.
Probability Model/Distribution
probability model/distribution
A probability model includes all possible outcomes of a chance experiment and the probabilities associated with those outcomes.
A probability model is also known as a probability distribution.
Notice the following important facts about probability distributions:
- The outcomes are random events.
- All outcomes are assigned a probability.
- The probabilities are numbers between [latex]0[/latex] and [latex]1[/latex]. This makes sense because each probability is a relative frequency.
- The sum of all of the probabilities is [latex]1[/latex]. This makes sense because we have listed all the outcomes. Since each probability is a relative frequency, these outcomes make up 100% of the observations.
The following table and graph display the probability model.
| Outcome |
Probability |
| Red | [latex]\dfrac{1}{3}[/latex] |
| Yellow | [latex]\dfrac{1}{3}[/latex] |
| Blue | [latex]\dfrac{1}{3}[/latex] |
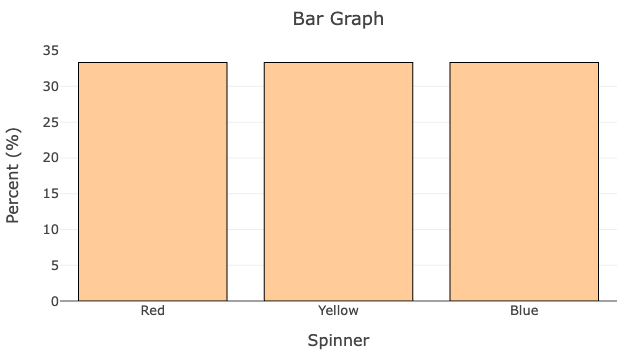
In this case, we can call this probability distribution a uniform probability distribution.