Objects in PowerPoint: Apply It 1

Type your Learning Goals text here

Le’ts take what we’ve learned about adding objects into a PowerPoint to update our assignment. Open the presentation you have saved as LastName_SalesInformation.pptx, if you don’t have it saved you can download the PowerPoint presentation.

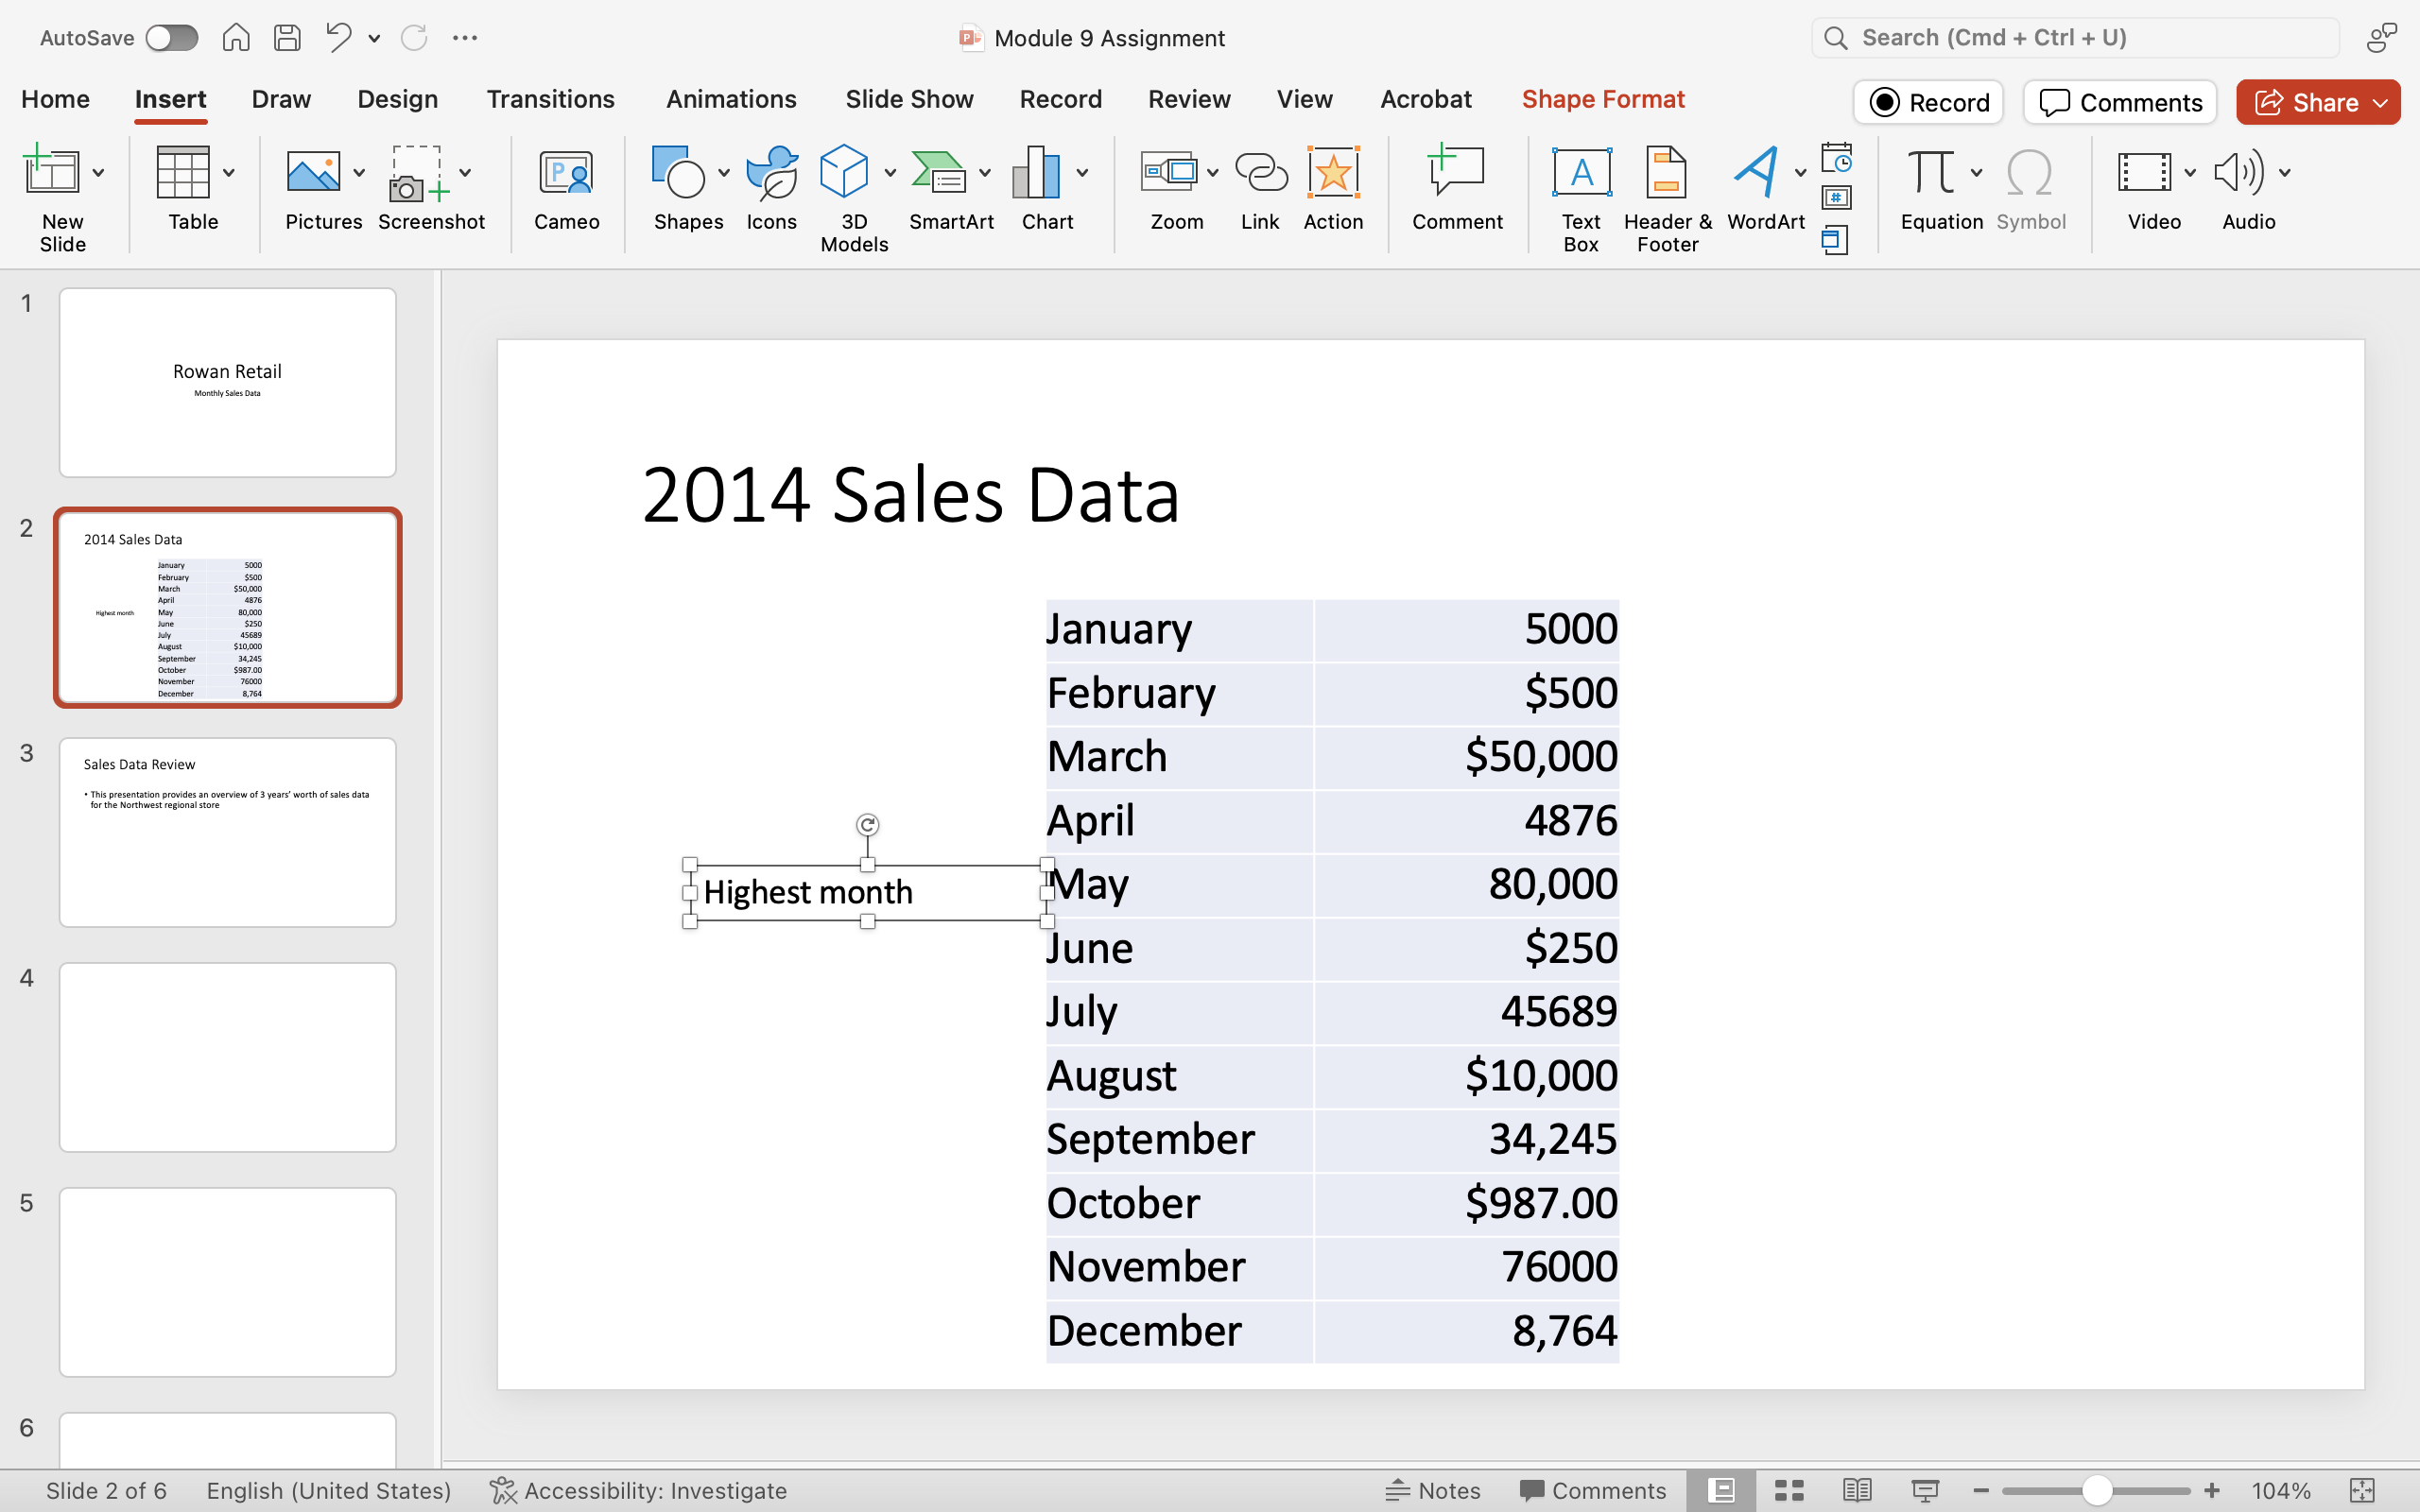
  1. Add a text box on slide 3 next to the month with the highest sales data that reads “Highest Month.” Your text box should be to the left of the month.
    A Microsoft Powerpoint deck is open with 6 slides created. A new text box has been opened on slide 3 with the text saying "Highest Month".
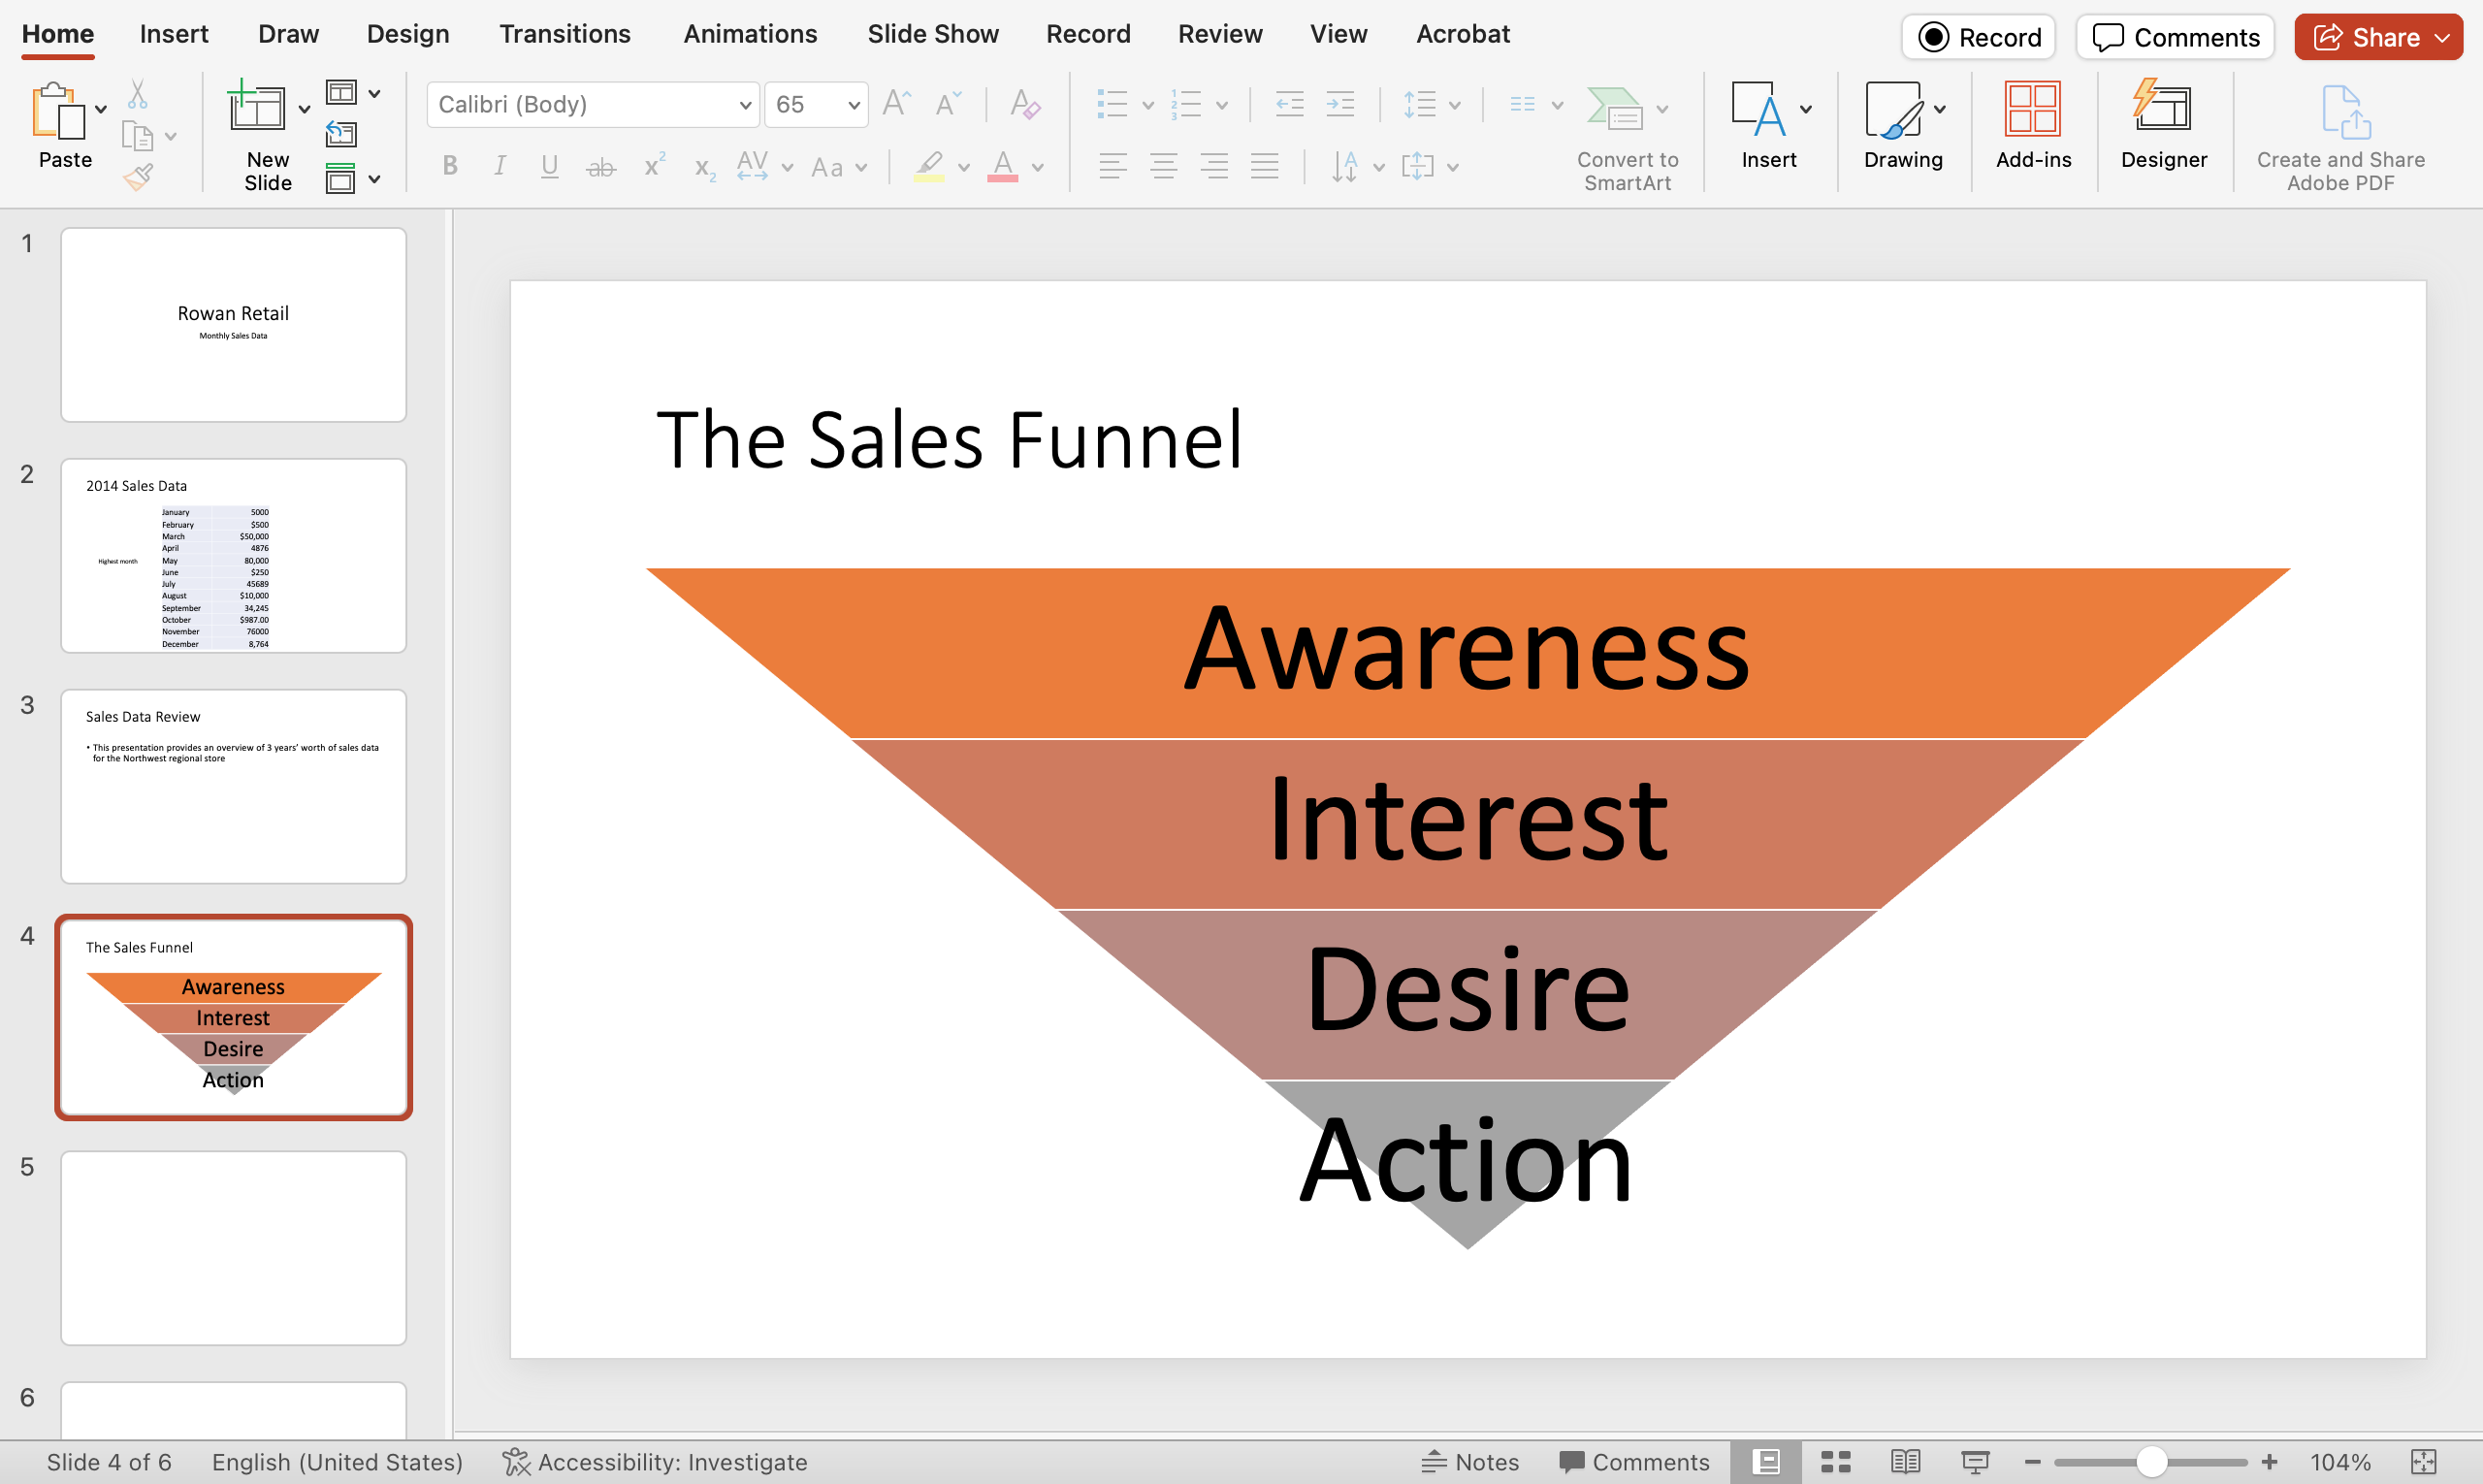
  2. On Slide 4 change the title to “The Sales Funnel”, then insert an “Inverted Triangle” SmartArt chart from the Hierarchy category and change the design and color scheme to something you like. Then, change the text in the chart to start with Awareness, Interest, Desire, and Action.
    The image is a screenshot of a PowerPoint presentation in edit mode. The slide visible is titled "The Sales Funnel" and contains a diagram of an inverted funnel with four horizontal sections labeled from top to bottom as follows: "Awareness," "Interest," "Desire," and "Action." Each section of the funnel is shaded in different shades of orange and brown, with "Awareness" at the top in the lightest shade and "Action" at the bottom in the darkest shade. The slide preview pane on the left shows other slides in the presentation, including "2014 Sales Data" on slide 3. The toolbar at the top displays various PowerPoint menu options like File, Home, Insert, Draw, Design, Transitions, Animations, Slide Show, Review, View, and Help.
  3. Save your work!