Images: Apply It 1

  • Insert images.
  • Change image layout options.

Earlier in the module we created a document called LastName_Report.docx and modified a table using the data in the document. Now, let’s finish the assignment with an embedded image.

  1. Open the document you saved called  LastName_Report.docx (if you don’t have the document you can download the report document and open it in Microsoft Word to start over)
  2. Download this image to your computer.
    A golden shopping cart is stationary in front of the frozen foods aisle at a grocery store. The shopping cart is empty.
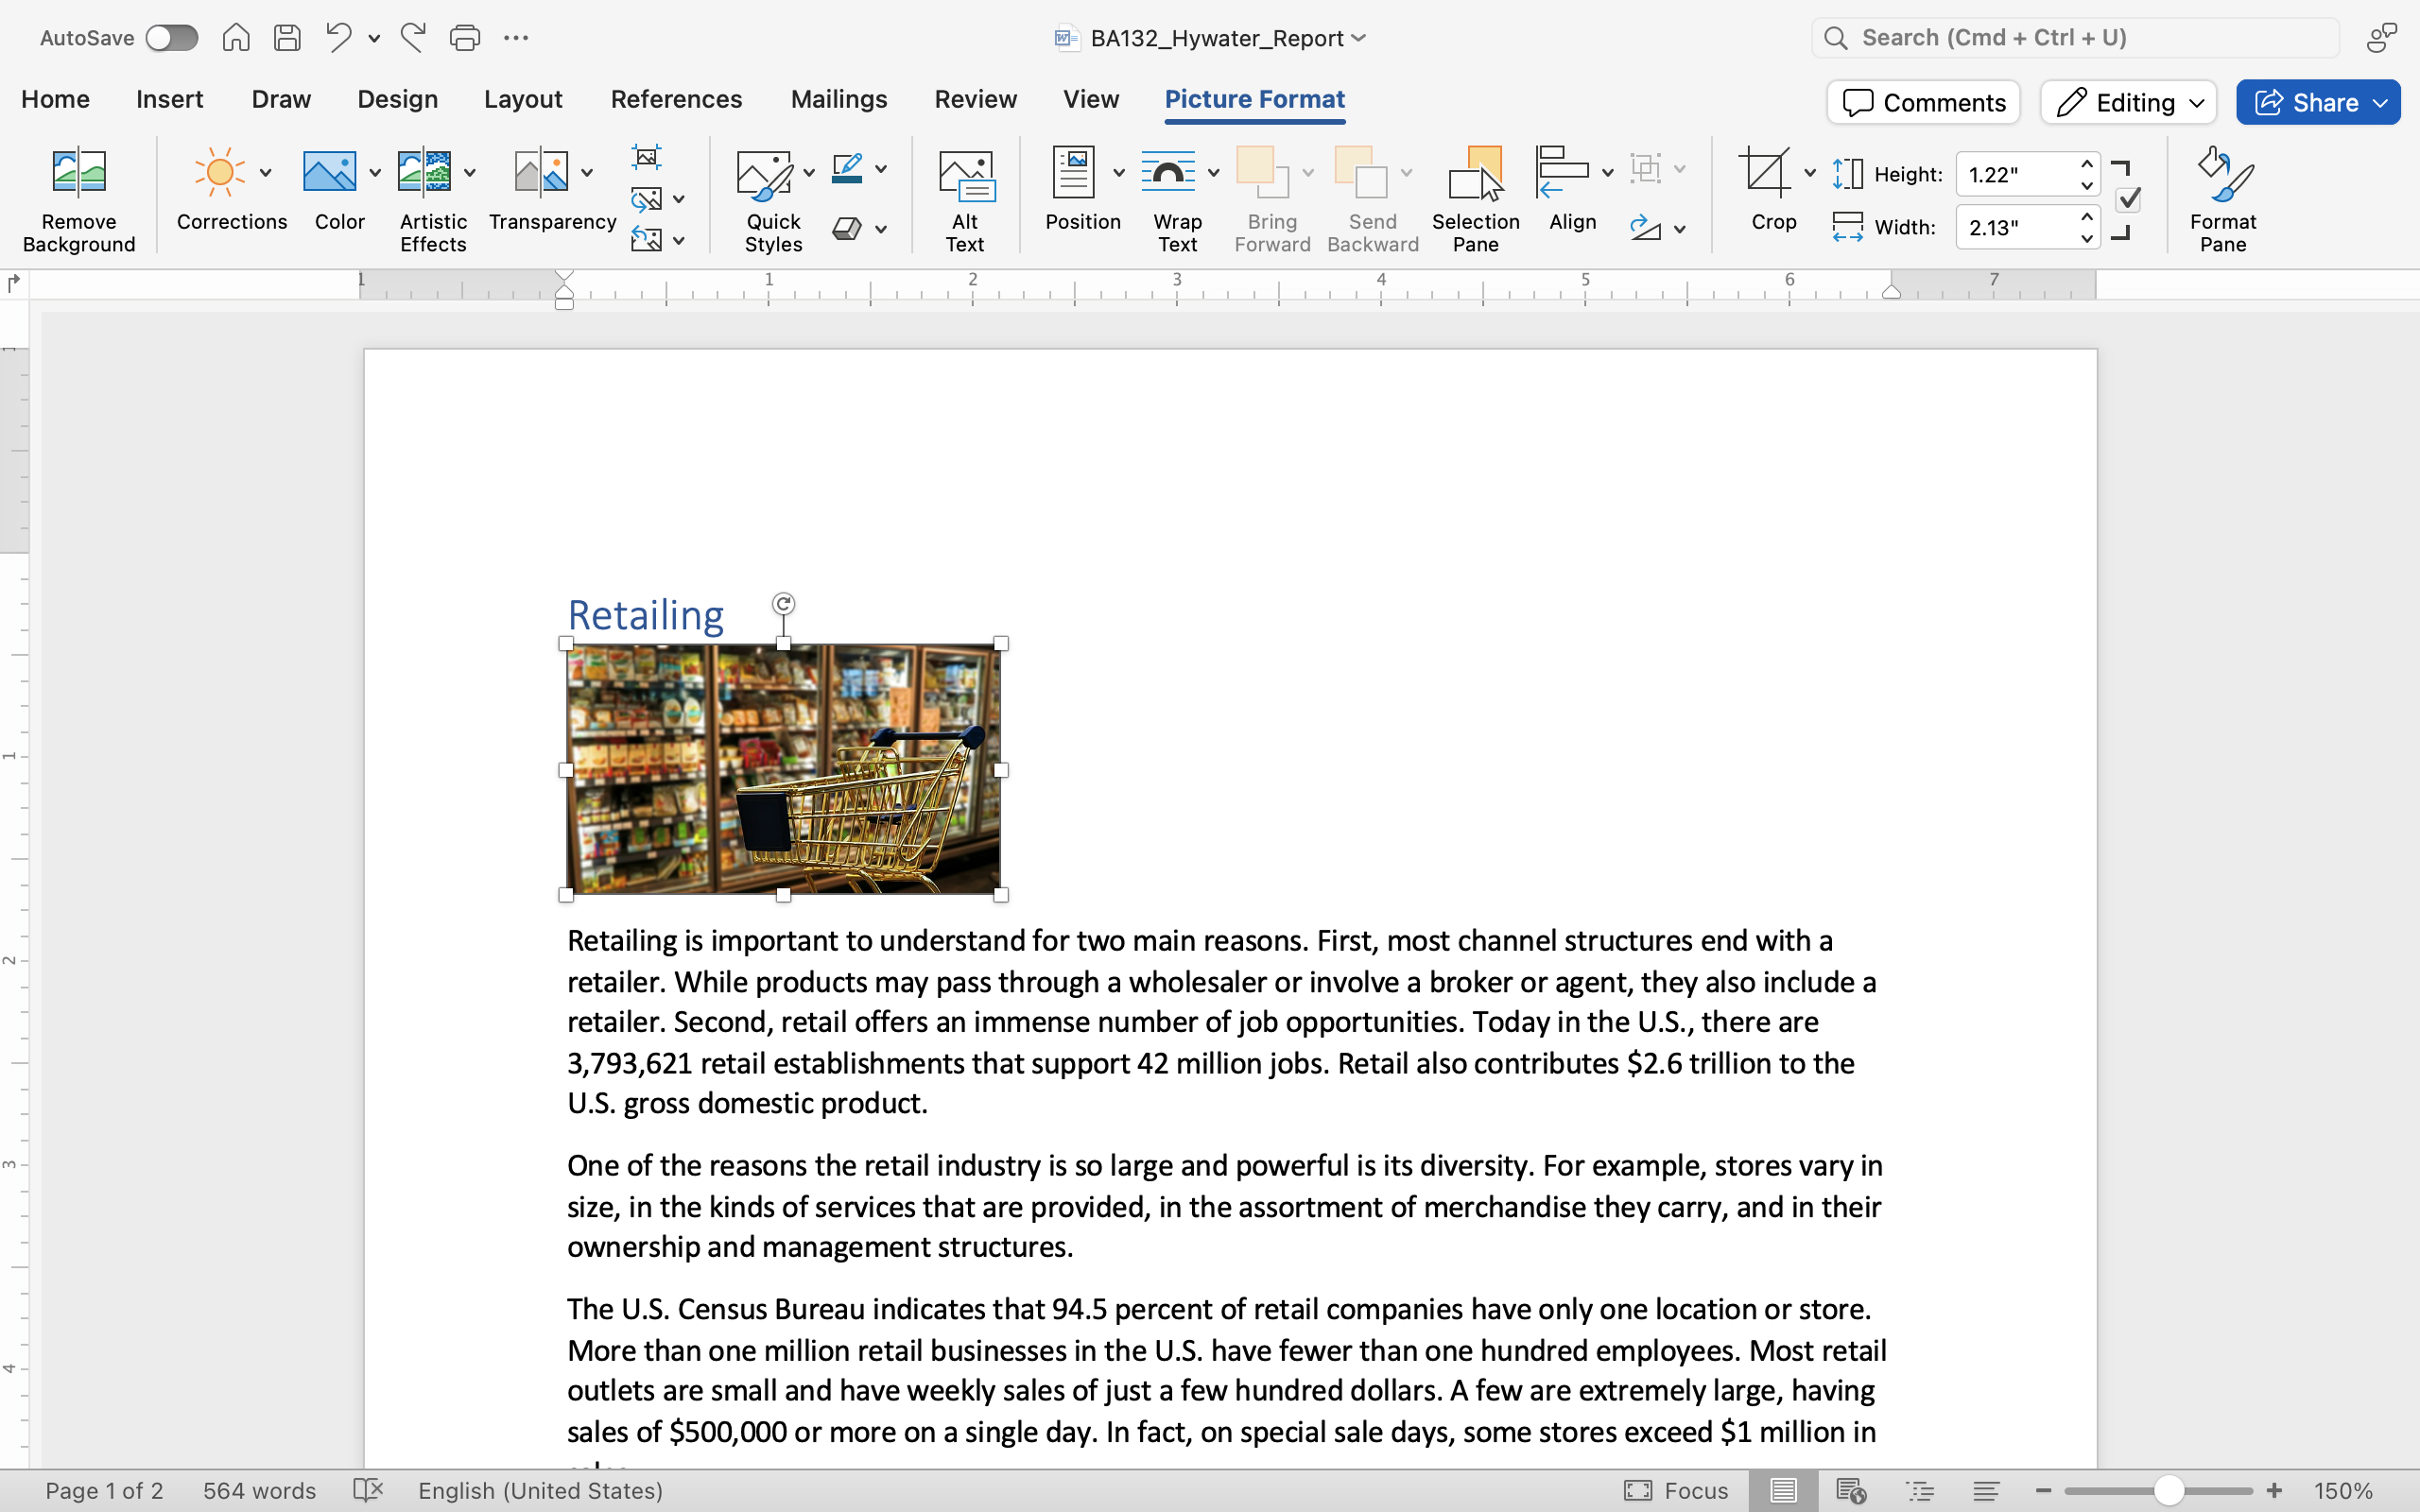
  3. Insert the shopping cart image into the document at the beginning of the first paragraph (It starts with “Retailing is important to understand”).
    A Microsoft word document with text on it. An image of a golden shopping cart is stationary in front of the frozen foods aisle at a grocery store. The shopping cart is empty.
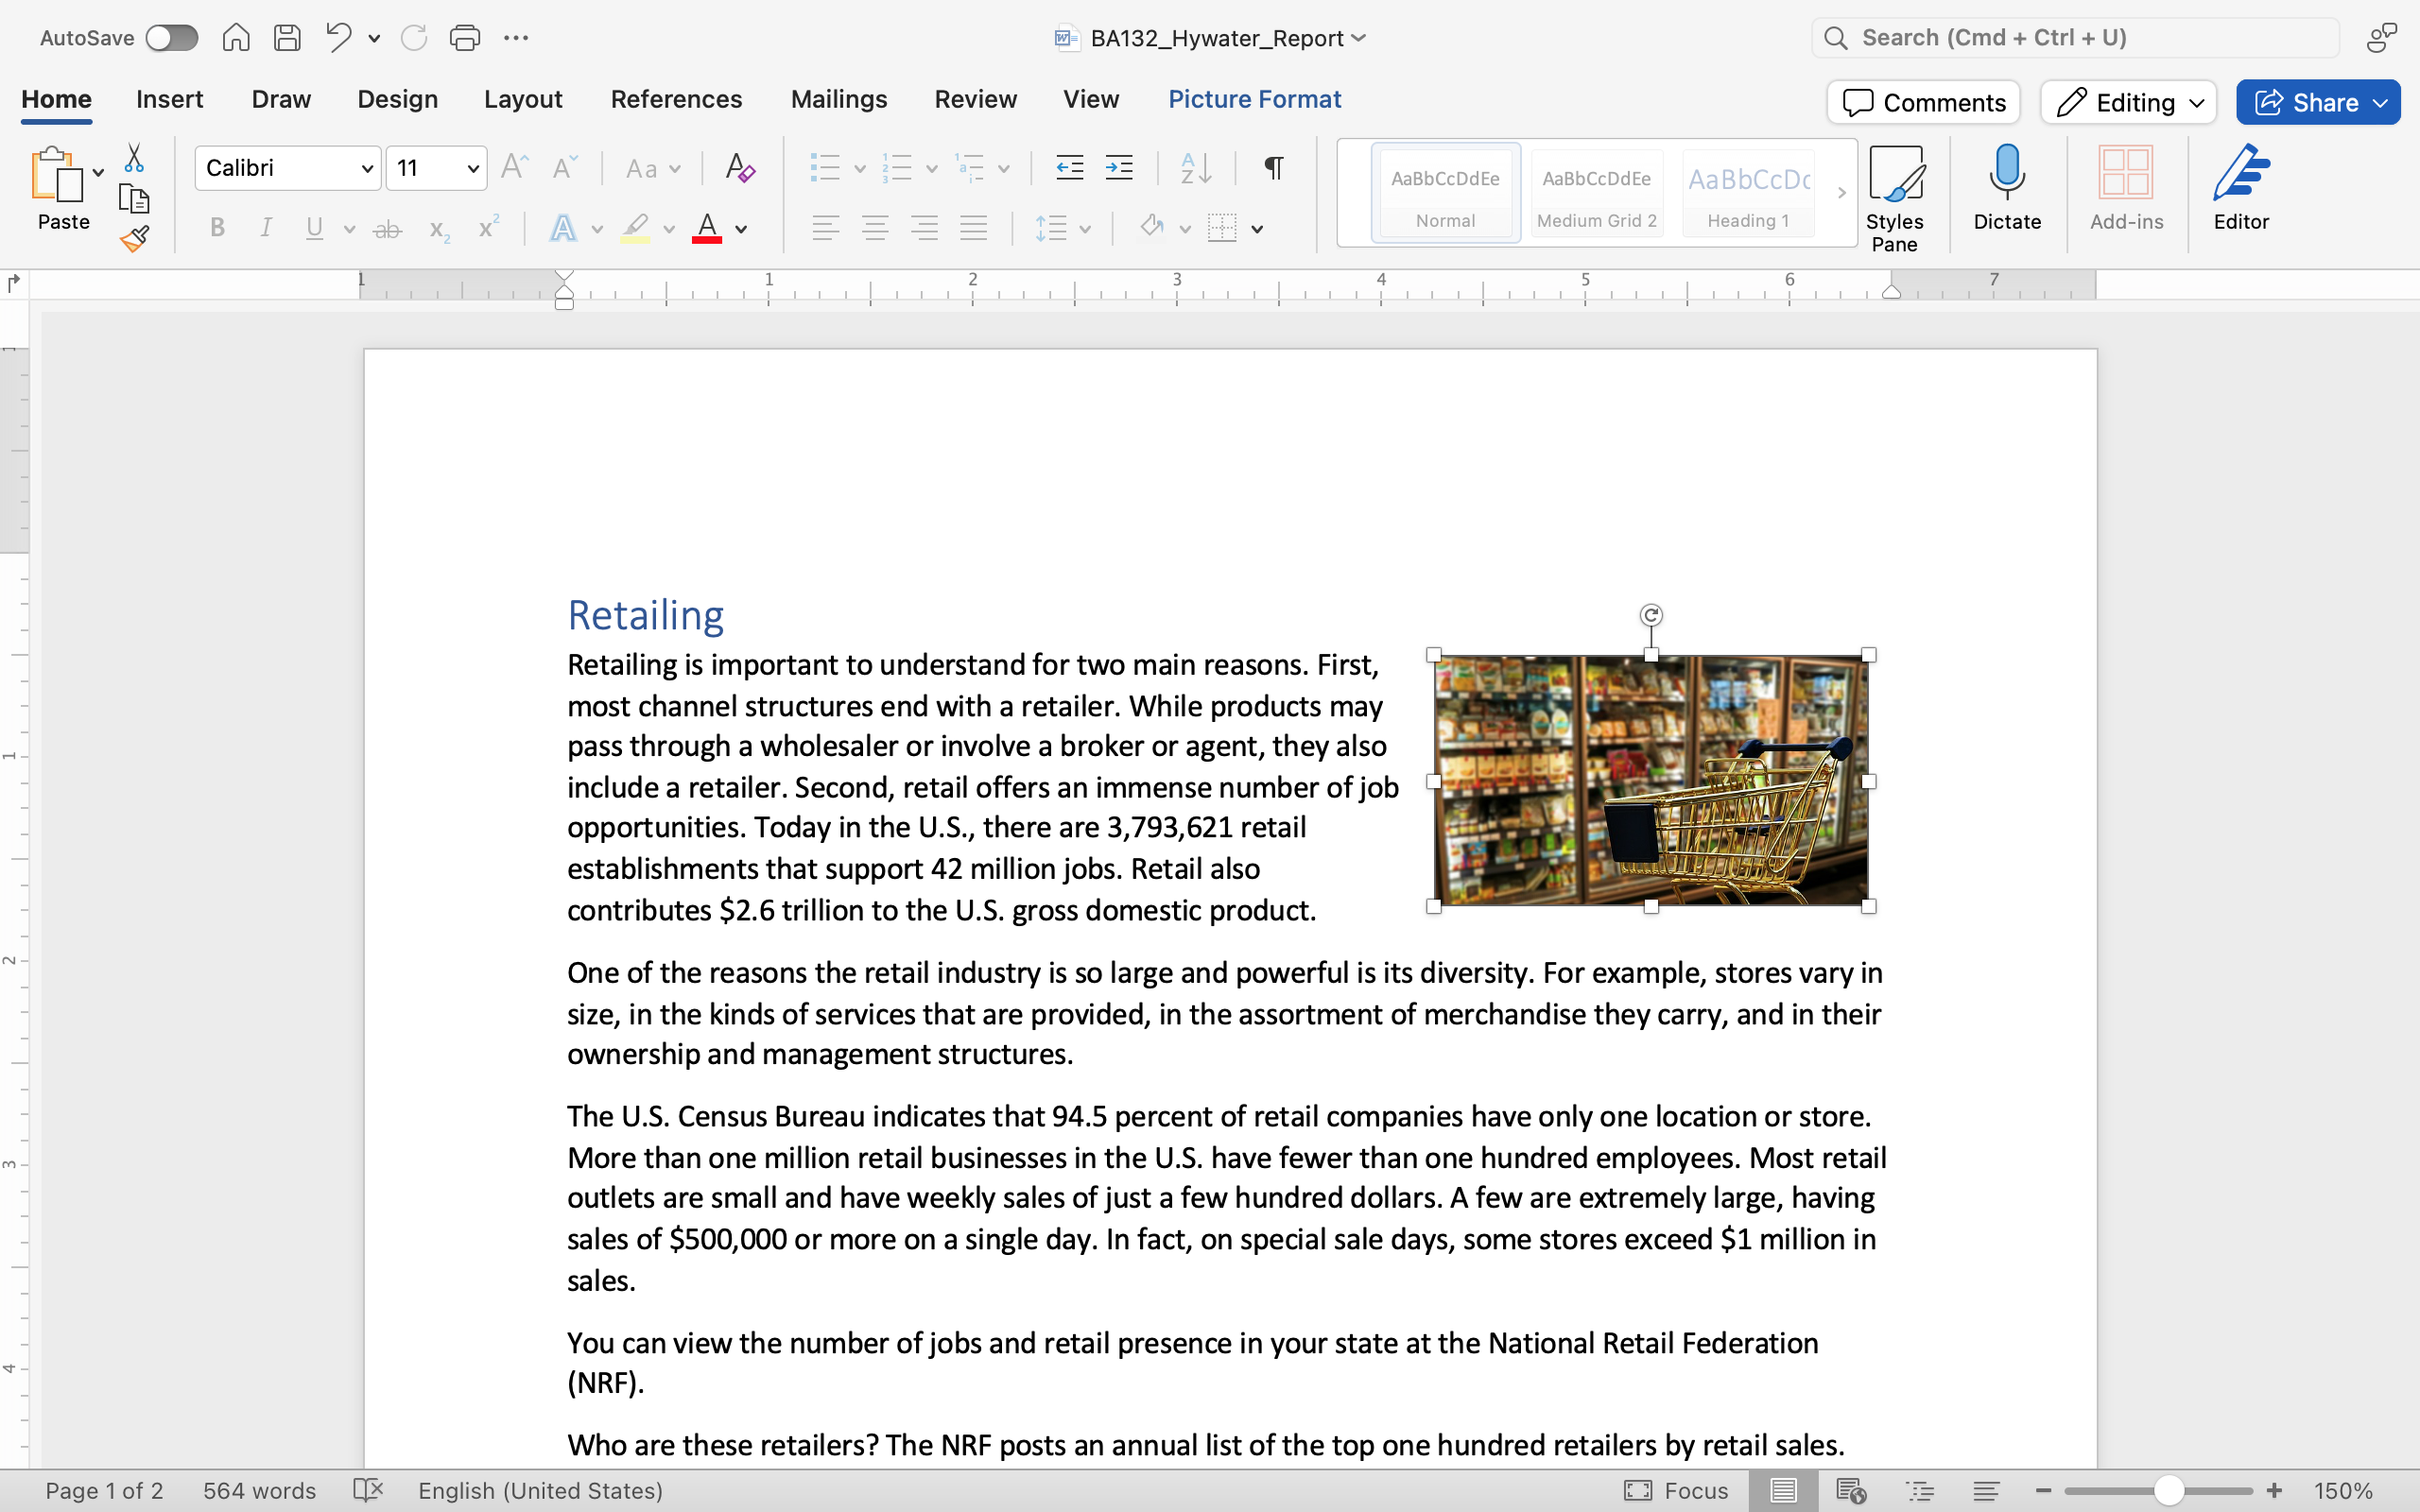
  4. Apply a square text wrap and move the image so it is aligned with the right side of the document.
    A Microsoft word document with text on it. An image of a golden shopping cart is stationary in front of the frozen foods aisle at a grocery store. The shopping cart is empty. The image has been aligned to the right and has been formatted to fit into the text.
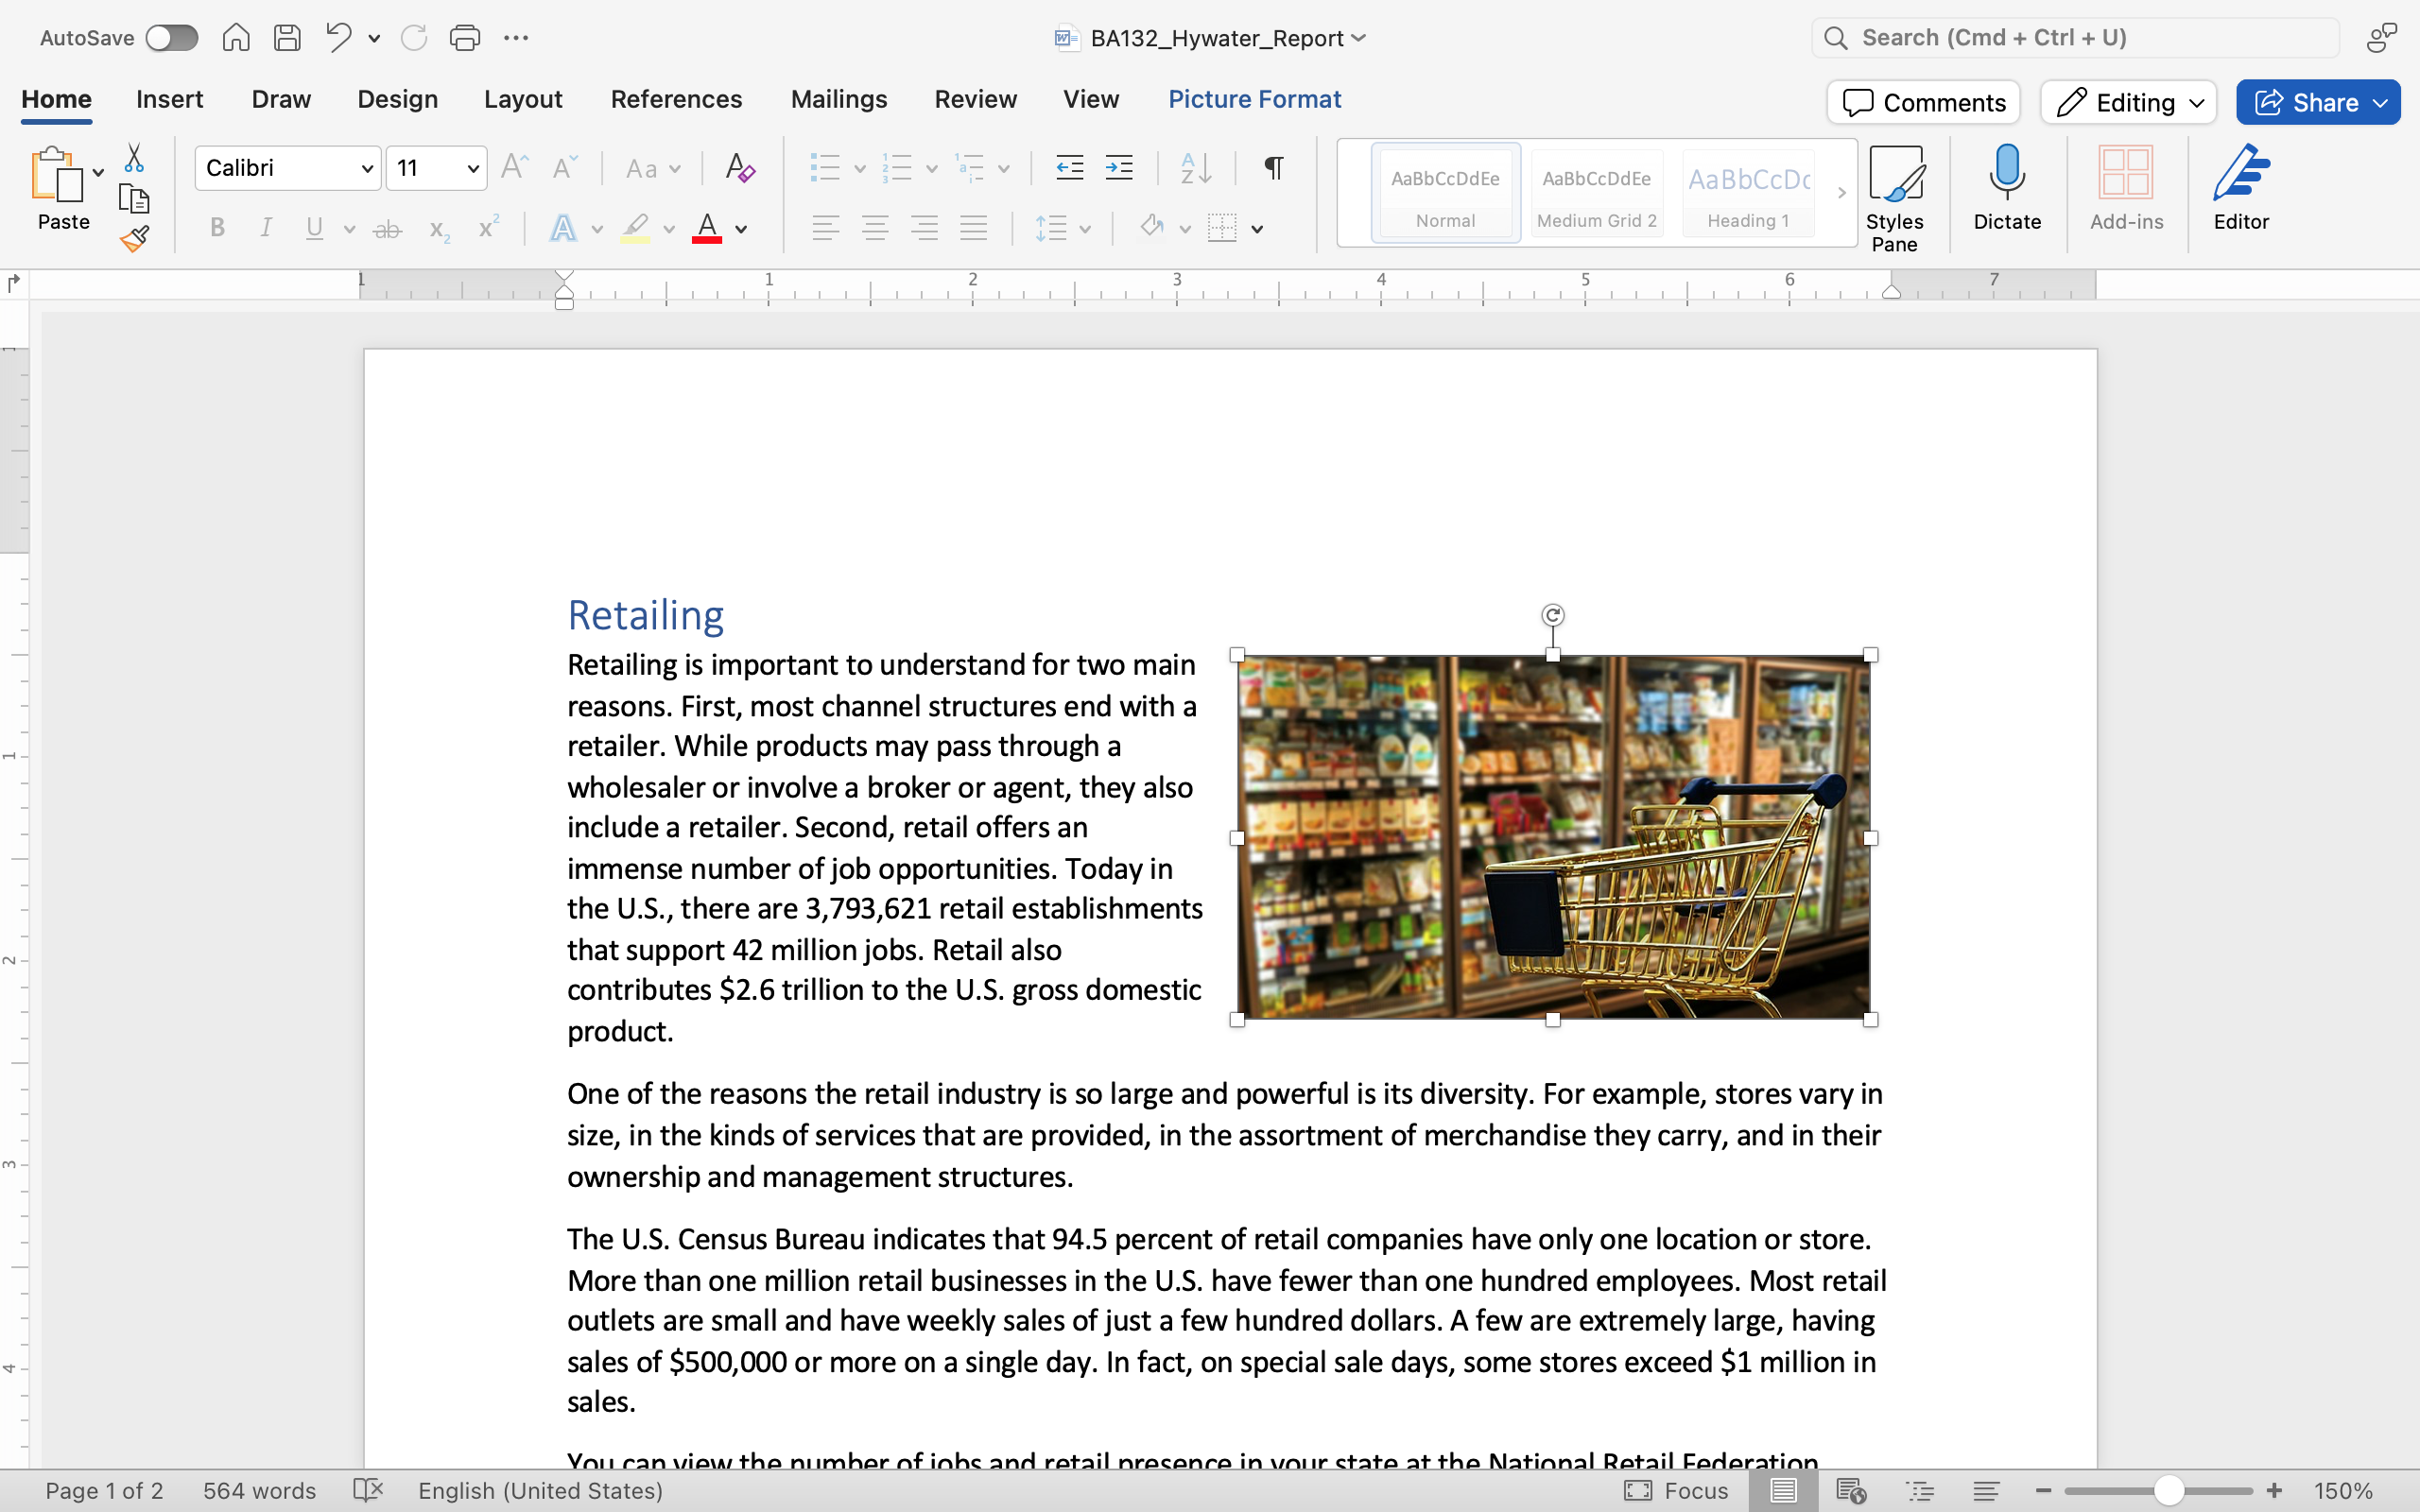
  5. Optional: Resize the image. (Remember, hold down the Shift key while dragging a corner to keep the image proportional.)
    A Microsoft word document with text on it. An image of a golden shopping cart is stationary in front of the frozen foods aisle at a grocery store. The shopping cart is empty. The image has been aligned to the right and has been formatted to fit into the text. The image has been resized to be displayed bigger.
  6. Download this graph image to your computer.
    A graph showing the "U.S Online Sales as a Percent of Retail Sales" is shown. On the Y-axis are 9 different percentages going from 0 through 8. On the X-axis there are 25 months listed which is just December and June alternating starting in June of 2003 and ending in June of 2015. The graph is a typical line graph and it starts at just under 2 percent in June of 2003 and ends at just over 7 percent by June 2015. The line is blue and it grows about 1 percent every 3 years.
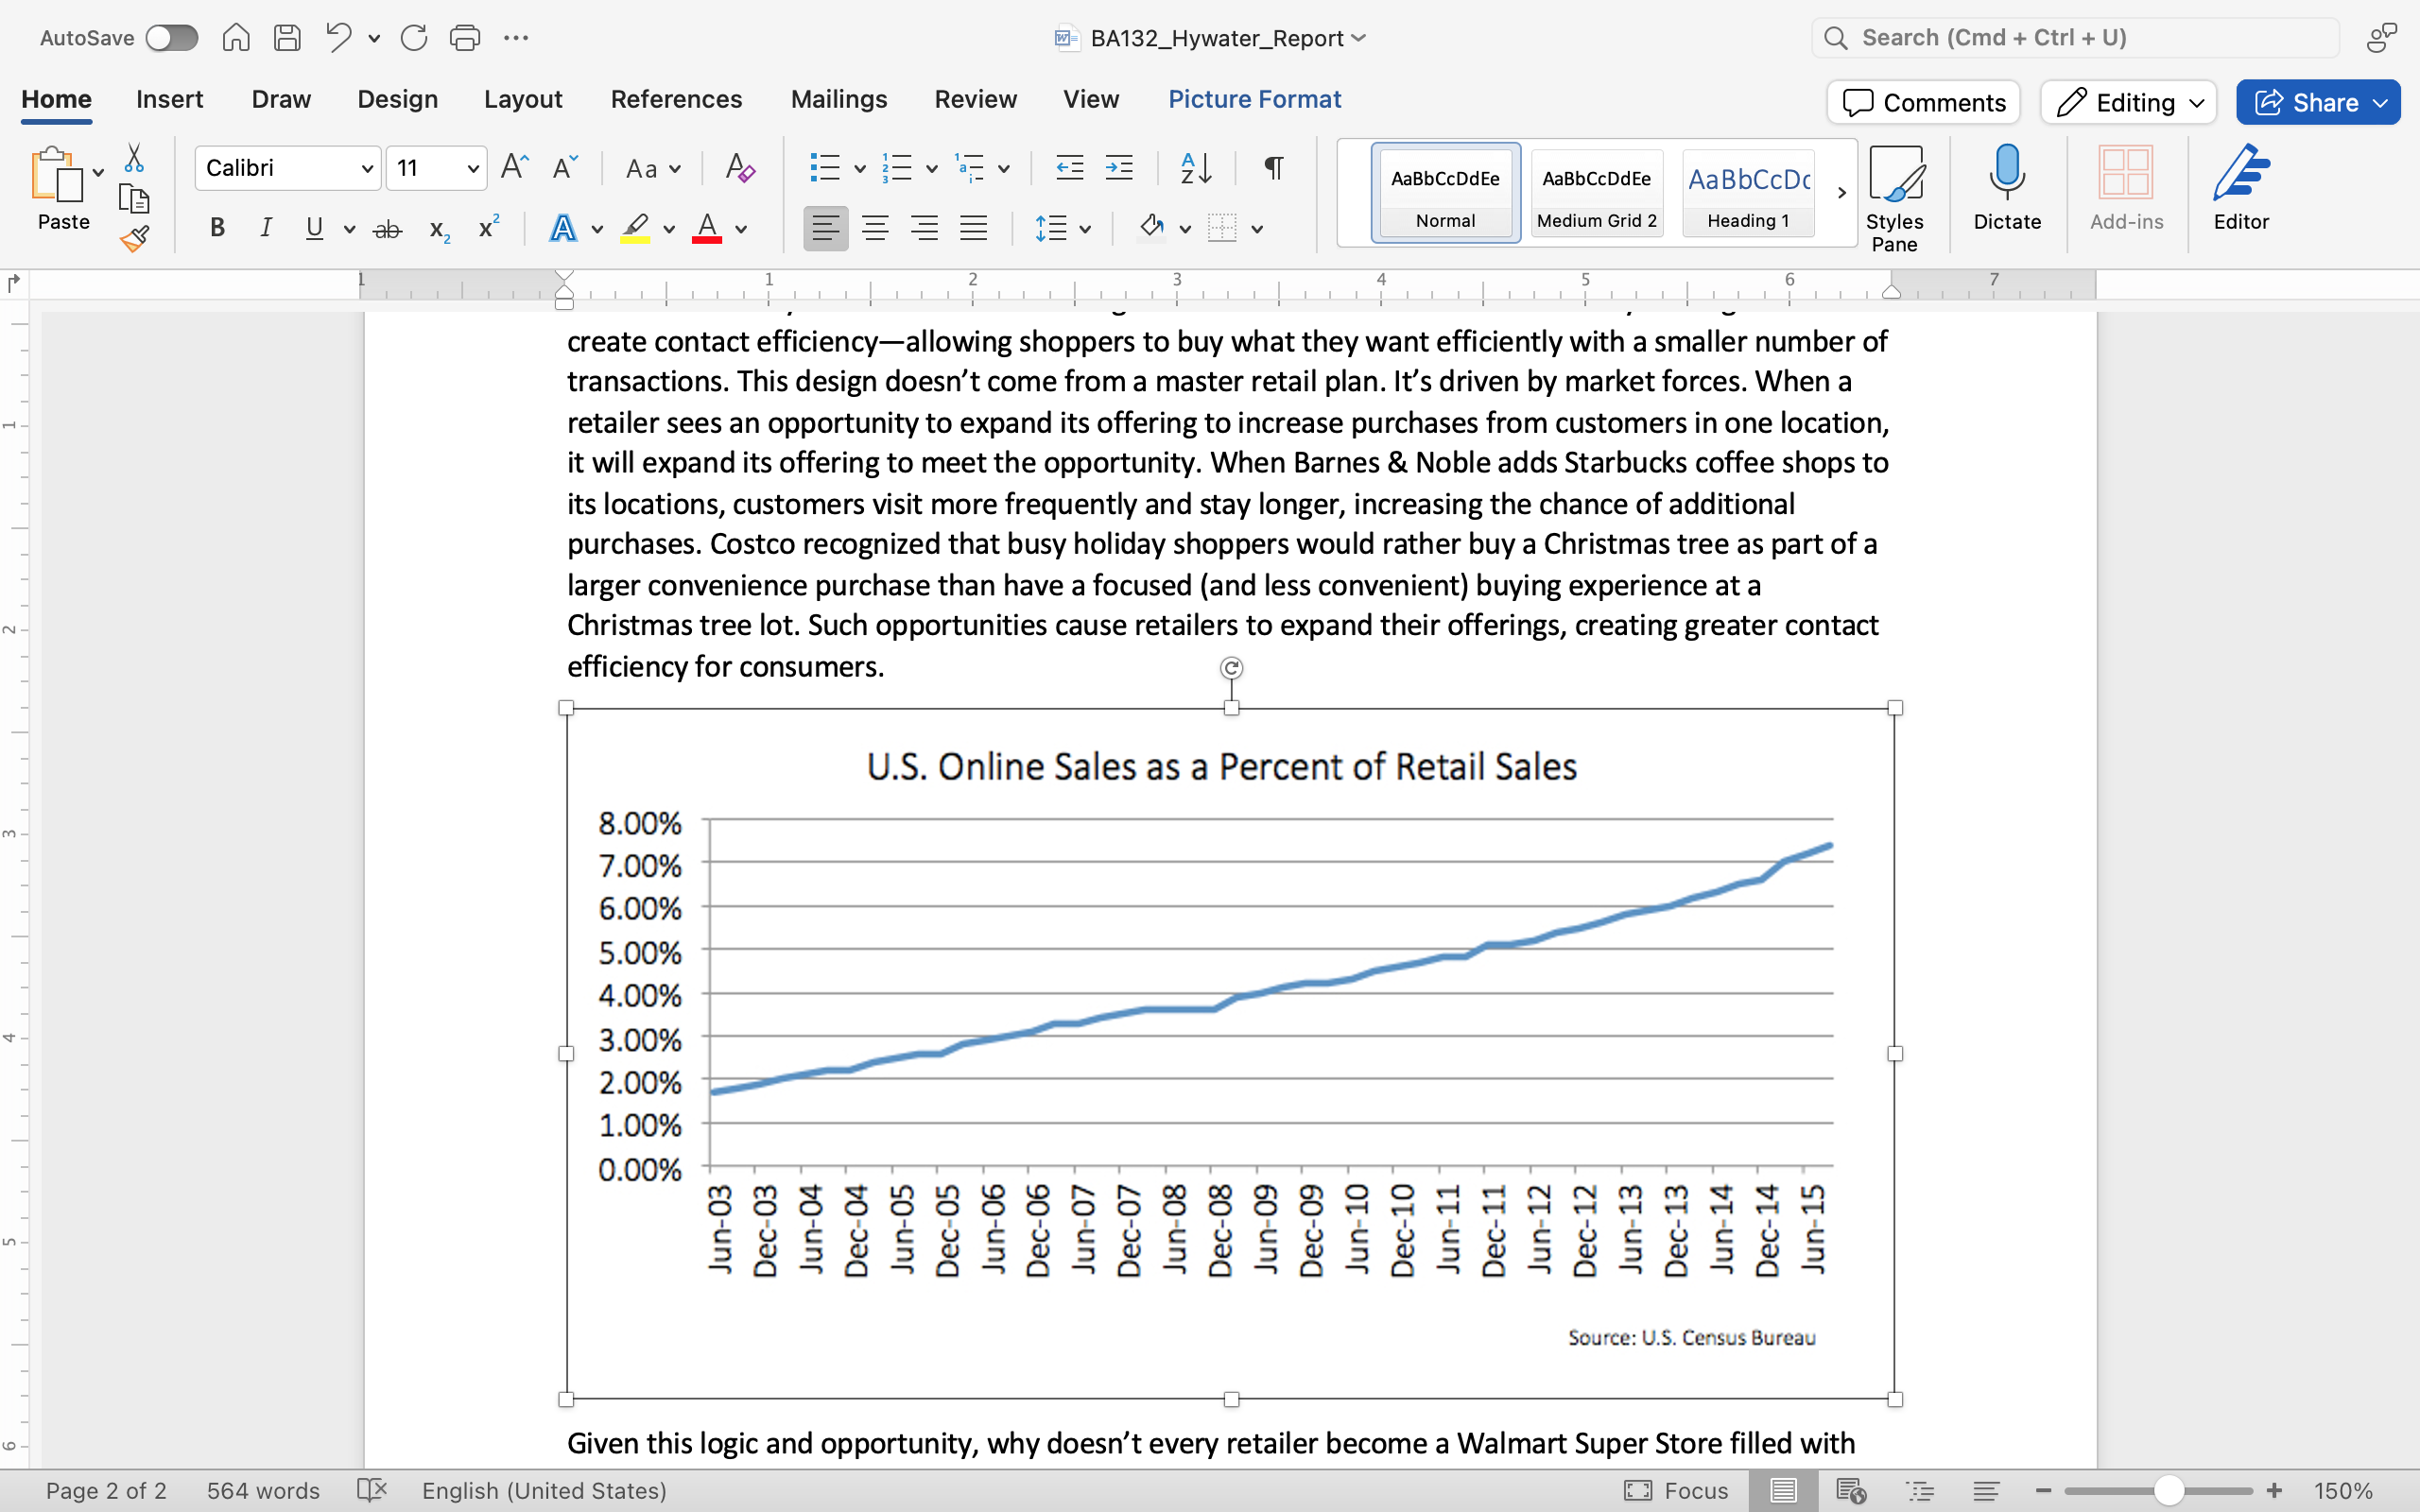
  7. Insert the graph image into your document after “creating greater contact efficiency for consumers.”
  8. Add a top and bottom text wrap to the graph image.
    A Microsoft Word document is open with a graph showing the "U.S Online Sales as a Percent of Retail Sales" is shown. On the Y-axis are 9 different percentages going from 0 through 8. On the X-axis there are 25 months listed which is just December and June alternating starting in June of 2003 and ending in June of 2015. The graph is a typical line graph and it starts at just under 2 percent in June of 2003 and ends at just over 7 percent by June 2015. The line is blue and it grows about 1 percent every 3 years.
  9. Save your document.