- Create a chart
- Format a chart
- Modify a chart
Open the presentation saved as LastName_QuarterSales.ppxt. If needed you can download the original unedited PowerPoint presentation here.
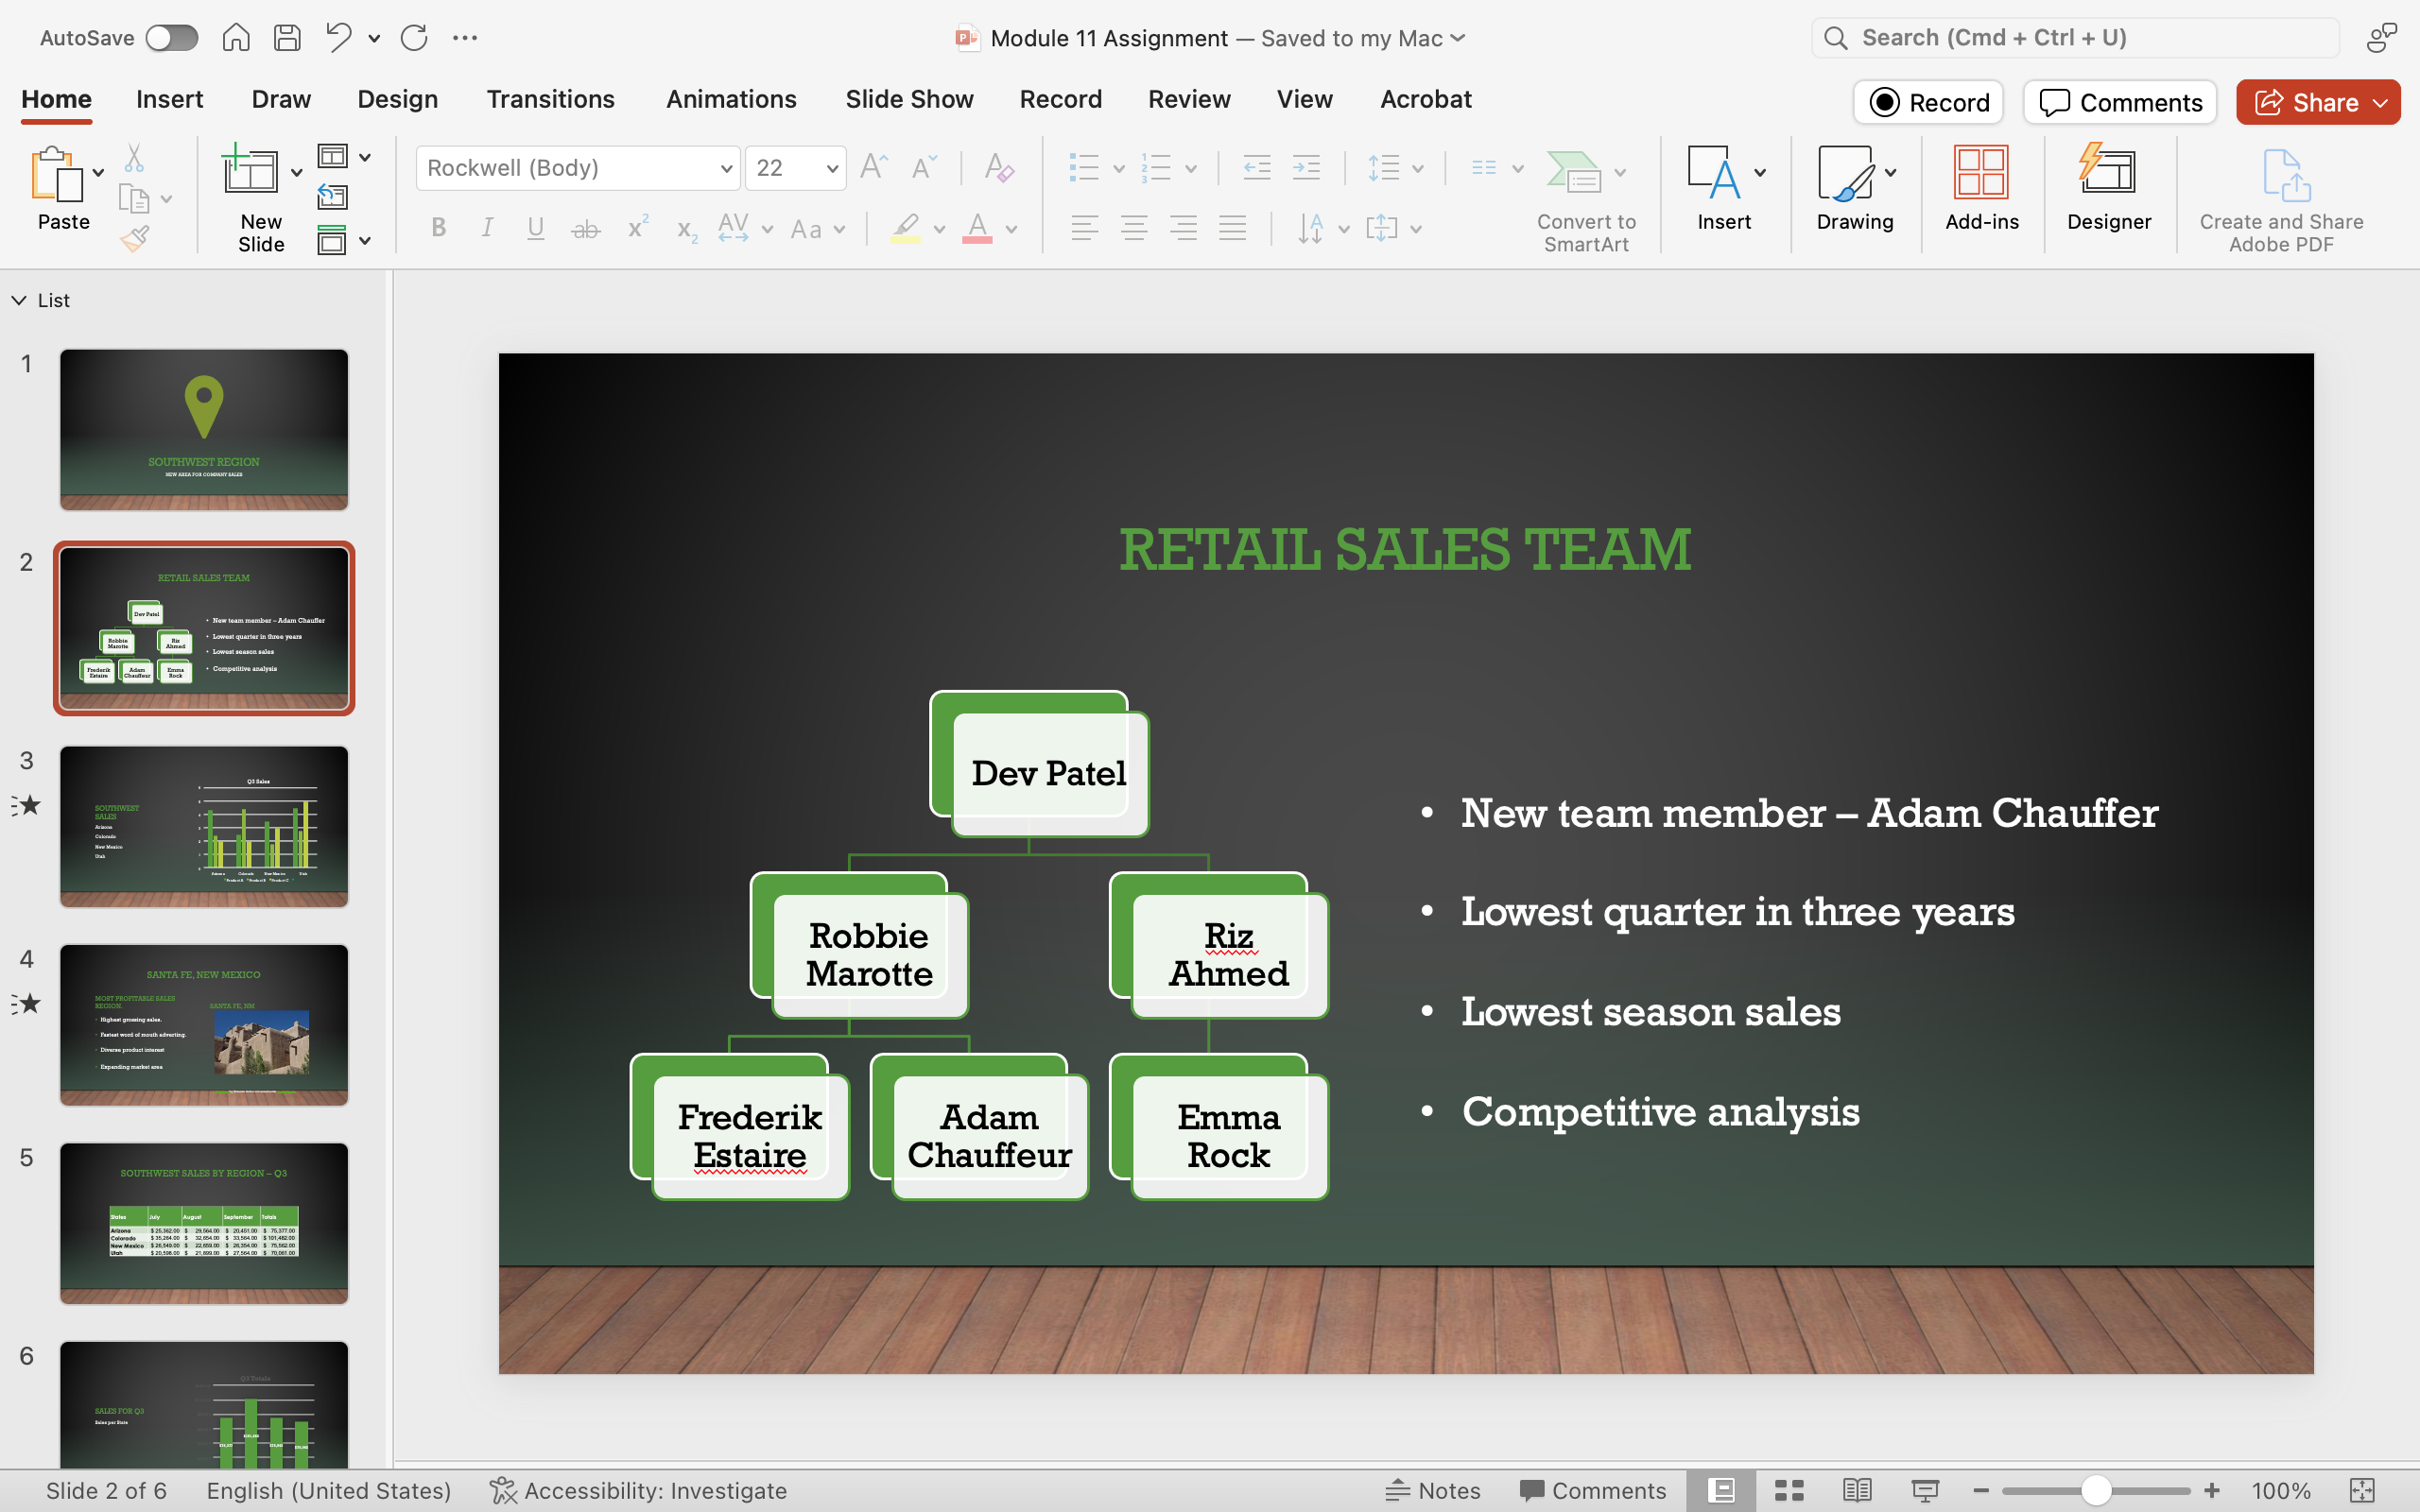
- Update Team: Change the team members to all new names and modify the bullet-point list to highlight other things about the team.
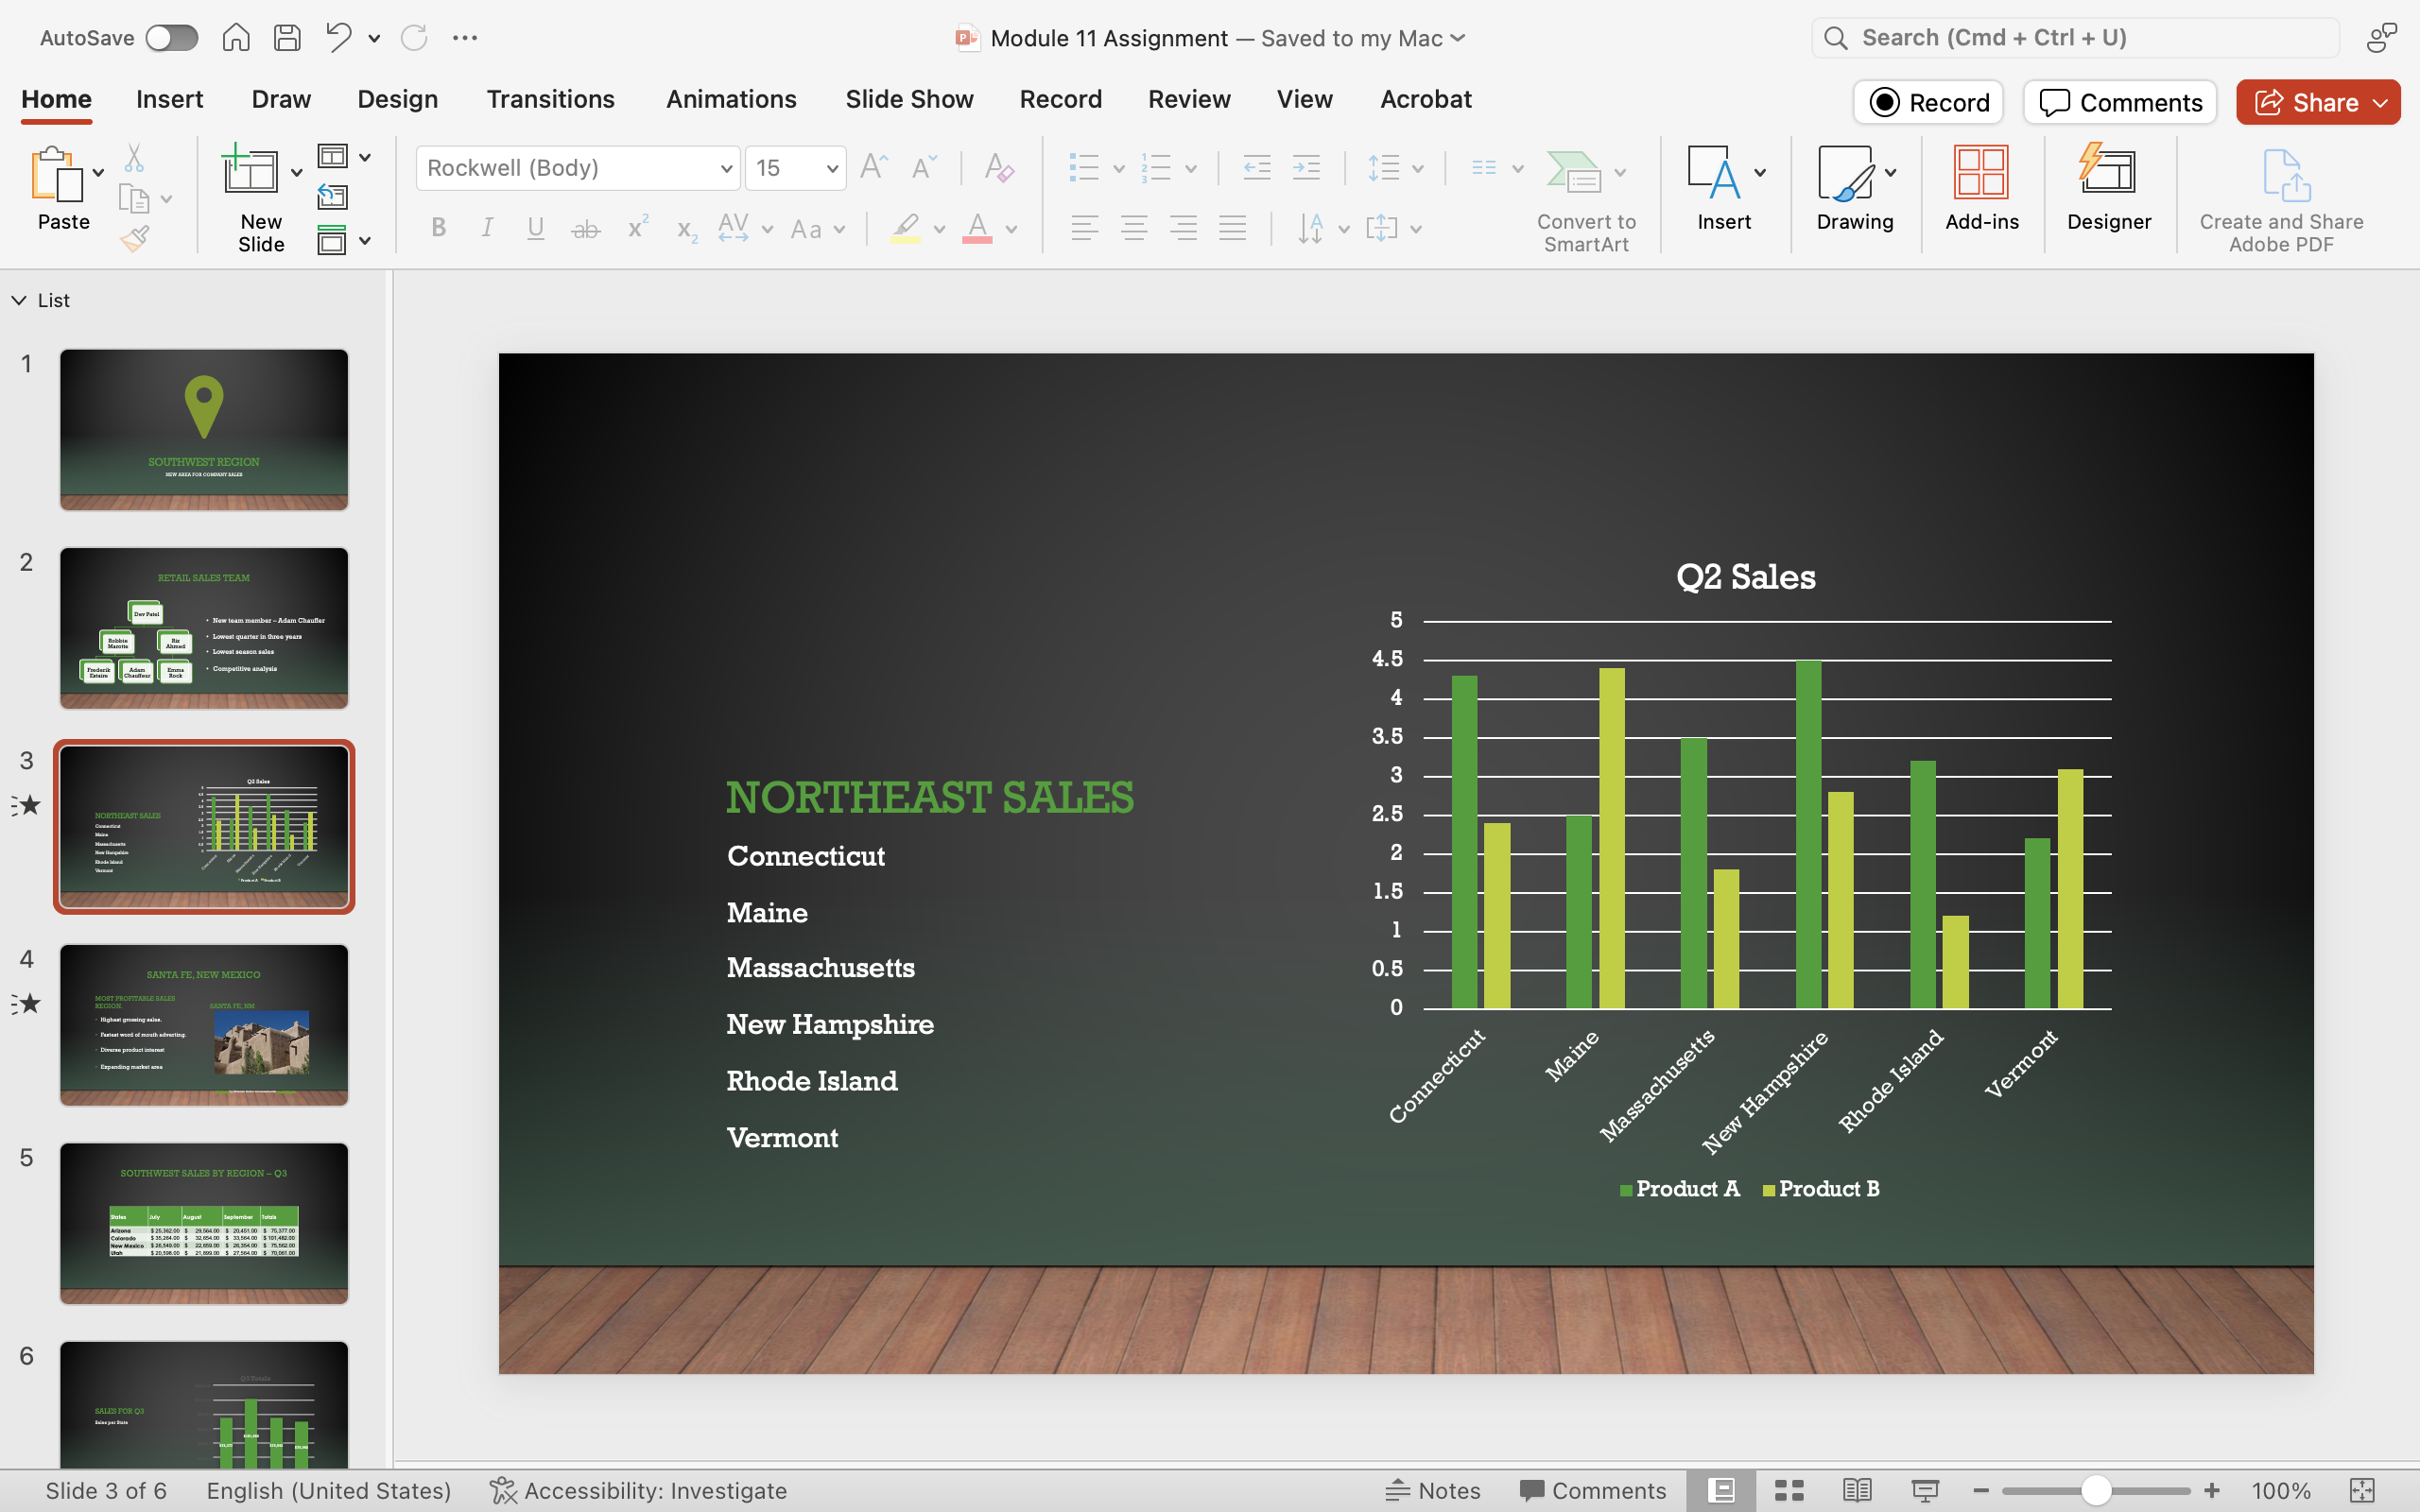
- Modify Chart Data: On the next slide, update the states and chart table data to reflect the Northeast regional sales. Move the text boxes and resize the chart to fit better on the slide with the additional states.
- Northeast Region information for the chart table for Q2 Sales:
| State | Product A | Product B |
|---|---|---|
| Connecticut | 4.3 | 2.4 |
| Maine | 2.5 | 4.4 |
| Massachusetts | 3.5 | 1.8 |
| New Hampshire | 4.5 | 2.8 |
| Rhode Island | 3.2 | 1.2 |
| Vermont | 2.2 | 3.1 |
- Delete Slide: Delete the next slide about Santa Fe, New Mexico.
- Save your work.