- Add charts
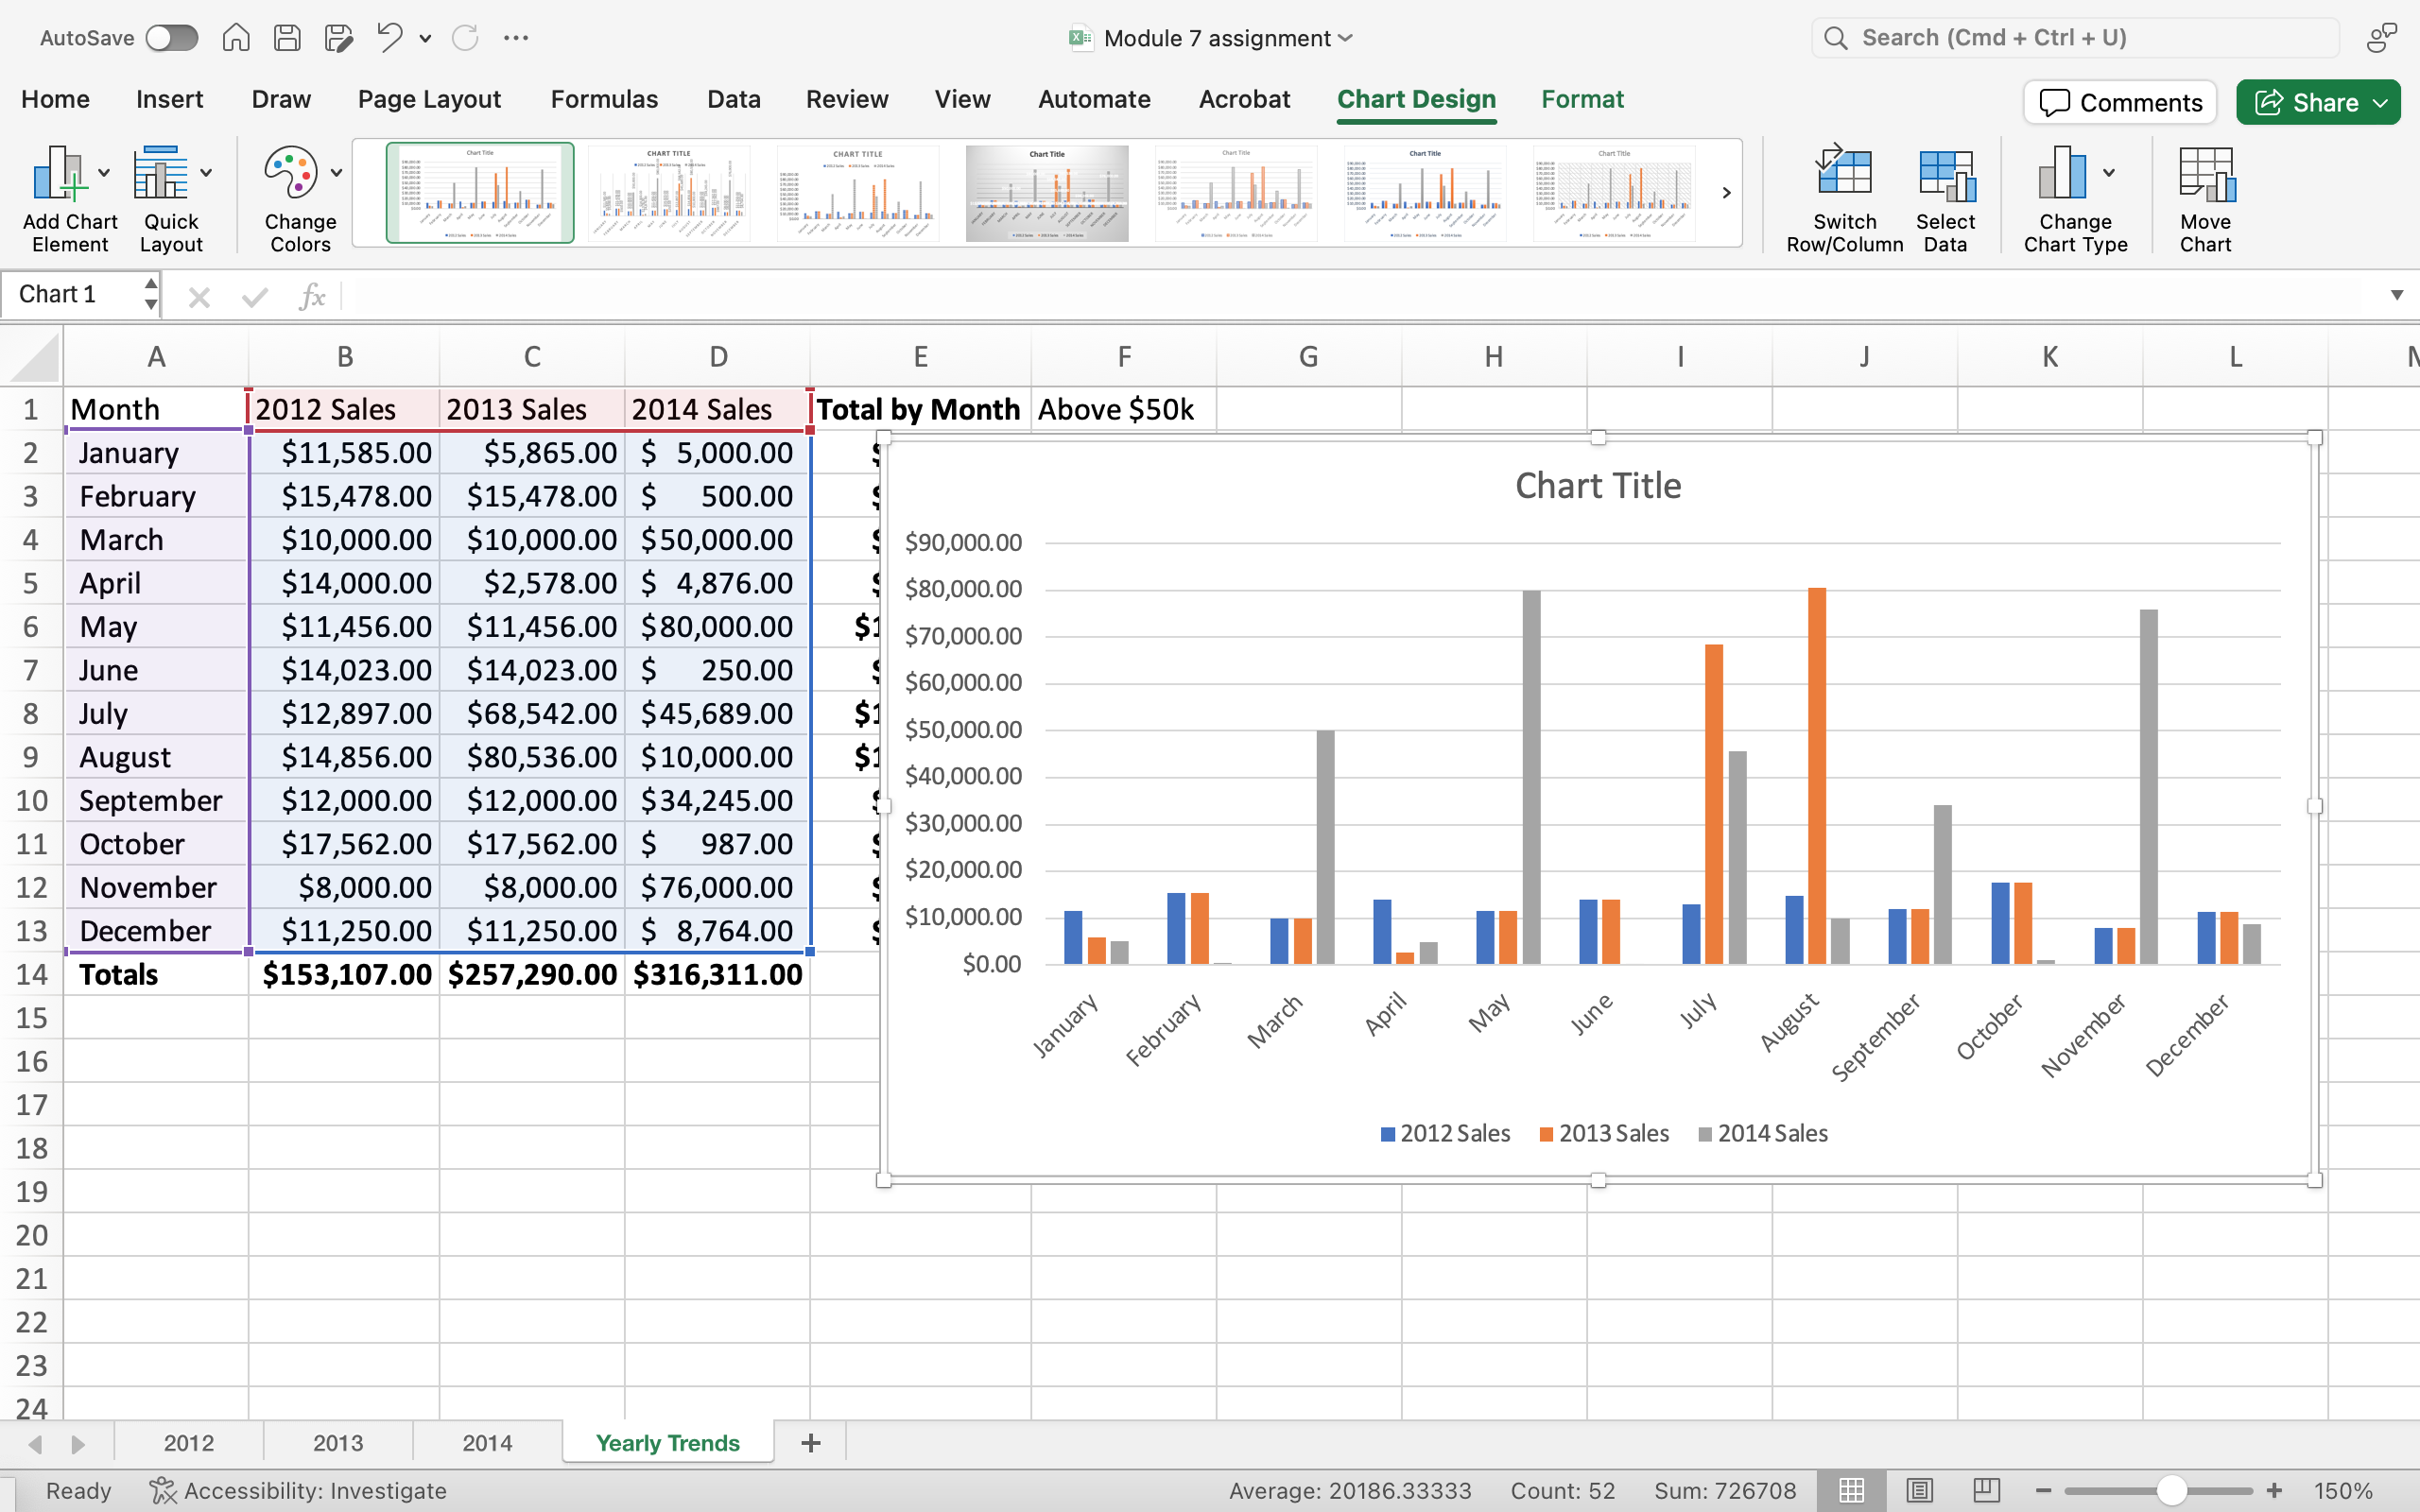
- Create a clustered column chart.
- Modify chart type.
- Open the document we started earlier this module called LastName_YearlyTrends.xlsx.
- Find the Yearly Trends tab and create a clustered column chart from the three year columns of your data.
- Save your work! You may need to submit it in your course online.