We can use what we have learned about multiplicities, end behavior, and turning points to sketch graphs of polynomial functions. Let us put this all together and look at the steps required to graph polynomial functions.
How to: Given a polynomial function, sketch the graph
Find the intercepts.
Check for symmetry. If the function is an even function, its graph is symmetric with respect to the [latex]y[/latex]-axis, that is, [latex]f(-x) = f(x)[/latex]. If a function is an odd function, its graph is symmetric with respect to the origin, that is, [latex]f(-x)=(f(-x)[/latex].
Use the multiplicities of the zeros to determine the behavior of the polynomial at the [latex]x[/latex]-intercepts.
Determine the end behavior by examining the leading term.
Use the end behavior and the behavior at the intercepts to sketch the graph.
Ensure that the number of turning points does not exceed one less than the degree of the polynomial.
Optionally, use technology to check the graph.
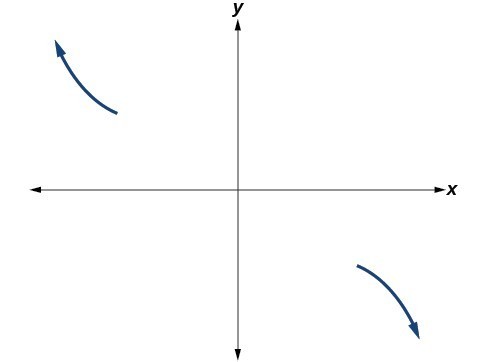
Sketch a possible graph for [latex]f\left(x\right)=-2{\left(x+3\right)}^{2}\left(x - 5\right)[/latex].
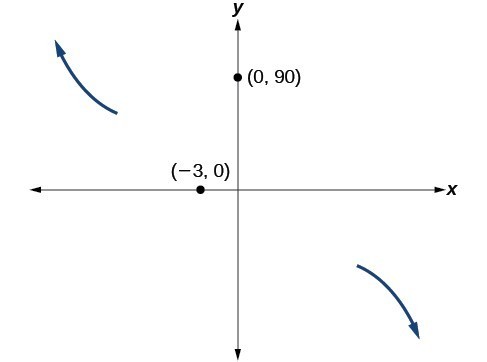
This graph has two [latex]x[/latex] intercepts. At [latex]x= –3[/latex], the factor is squared, indicating a multiplicity of [latex]2[/latex]. The graph will bounce off the [latex]x[/latex]-intercept at this value. At [latex]x= 5[/latex], the function has a multiplicity of one, indicating the graph will cross through the axis at this intercept. The [latex]y[/latex]-intercept is found by evaluating [latex]f(0)[/latex].
The [latex]y[/latex]-intercept is [latex](0, 90)[/latex]. Additionally, we can see the leading term, if this polynomial were multiplied out, would be [latex]-2{x}^{3}[/latex], so the end behavior, as seen in the following graph, is that of a vertically reflected cubic with the outputs decreasing as the inputs approach infinity and the outputs increasing as the inputs approach negative infinity.
To sketch the graph, we consider the following:
As [latex]x\to -\infty[/latex] the function [latex]f\left(x\right)\to \infty[/latex], so we know the graph starts in the second quadrant and is decreasing toward the [latex]x[/latex]-axis.
Since [latex]f\left(-x\right)=-2{\left(-x+3\right)}^{2}\left(-x - 5\right)[/latex] is not equal to [latex]f(x)[/latex], the graph does not have any symmetry.
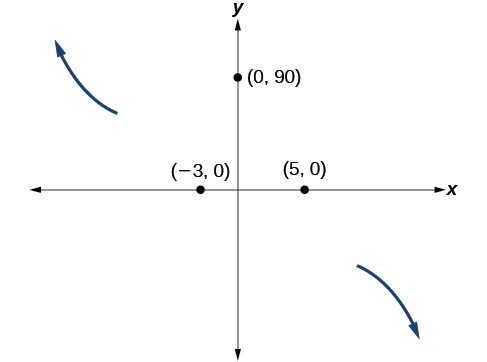
At [latex]\left(-3,0\right)[/latex] the graph bounces off of the [latex]x[/latex]-axis, so the function must start increasing after this point.
At [latex](0, 90)[/latex], the graph crosses the [latex]y[/latex]-axis.
Somewhere after this point, the graph must turn back down or start decreasing toward the horizontal axis because the graph passes through the next intercept at [latex](5, 0)[/latex].
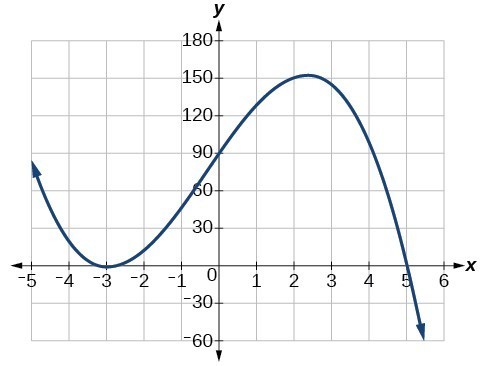
As [latex]x\to \infty[/latex] the function [latex]f\left(x\right)\to \mathrm{-\infty }[/latex], so we know the graph continues to decrease, and we can stop drawing the graph in the fourth quadrant. The complete graph of the polynomial function [latex]f\left(x\right)=-2{\left(x+3\right)}^{2}\left(x - 5\right)[/latex] is as follows:
Writing Formulas for Polynomial Functions
Now that we know how to graph polynomial functions, we can use them to write formulas.
How To: Given a graph of a polynomial function, write a formula for the function
Identify the [latex]x[/latex]-intercepts of the graph to find the factors of the polynomial.
Examine the behavior of the graph at the [latex]x[/latex]-intercepts to determine the multiplicity of each factor.
Find the polynomial of least degree containing all of the factors found in the previous step.
Use any other point on the graph (the [latex]y[/latex]-intercept may be easiest) to determine the stretch factor.
Write a formula for the polynomial function.
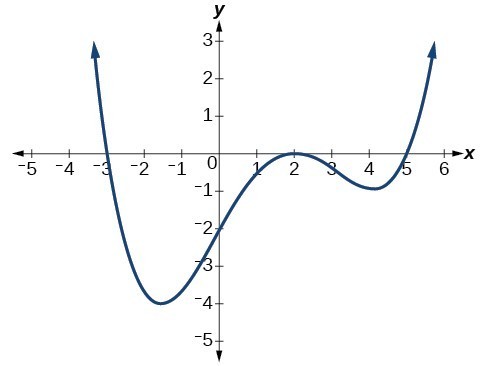
This graph has three [latex]x[/latex]-intercepts: [latex]x= –3, 2,[/latex] and [latex]5[/latex]. The [latex]y[/latex]-intercept is located at [latex](0, 2)[/latex]. At [latex]x= –3[/latex] and [latex]x= 5[/latex], the graph passes through the axis linearly, suggesting the corresponding factors of the polynomial will be linear. At [latex]x= 2[/latex], the graph bounces off the [latex]x[/latex]-axis at the intercept suggesting the corresponding factor of the polynomial will be second-degree (quadratic). Together, this gives us
To determine the stretch factor, we utilize another point on the graph. We will use the [latex]y[/latex]-intercept [latex](0, –2)[/latex], to solve for [latex]a[/latex].
The graphed polynomial appears to represent the function [latex]f\left(x\right)=\frac{1}{30}\left(x+3\right){\left(x - 2\right)}^{2}\left(x - 5\right)[/latex].