Graphing Linear Functions Cont.
Graphing a Linear Function Using Transformations
Another option for graphing is to use transformations on the identity function [latex]f\left(x\right)=x[/latex]. A function may be transformed by a shift up, down, left, or right. A function may also be transformed using a reflection, stretch, or compression.
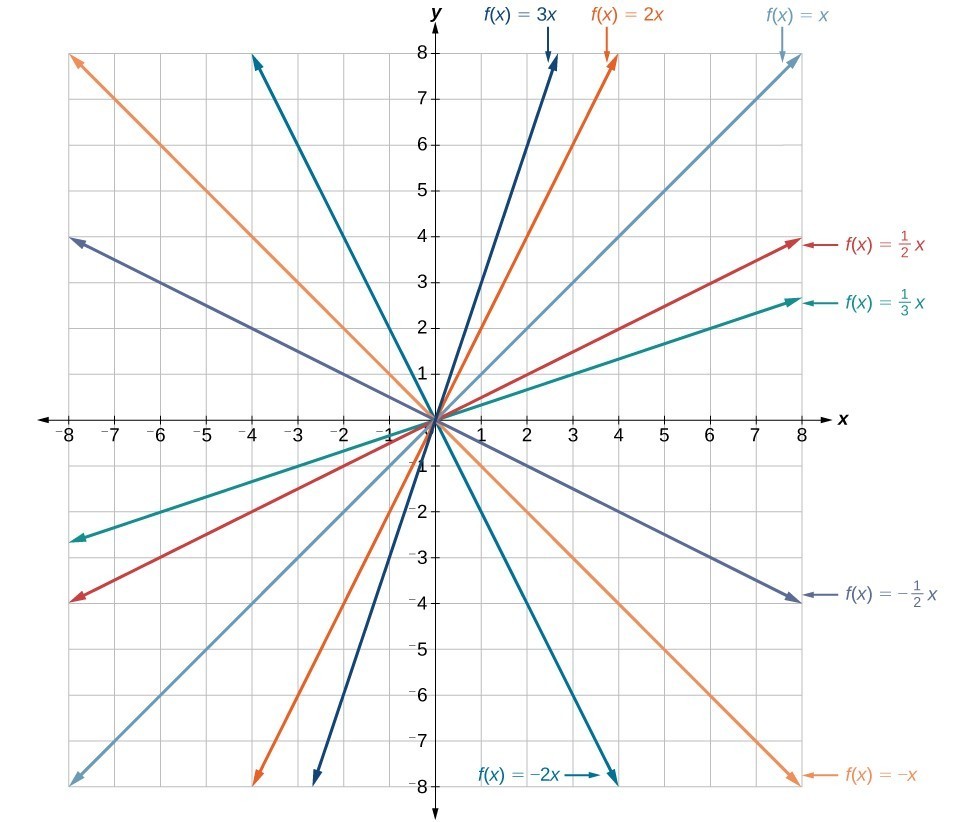
Vertical Stretch or Compression
In the equation [latex]f\left(x\right)=mx[/latex], the [latex]m[/latex] is acting as the vertical stretch or compression of the identity function. When [latex]m[/latex] is negative, there is also a vertical reflection of the graph. Notice that multiplying the equation [latex]f\left(x\right)=x[/latex] by [latex]m[/latex] stretches the graph of [latex]f[/latex] by a factor of [latex]m[/latex] units if [latex]m > 1[/latex] and compresses the graph of [latex]f[/latex] by a factor of [latex]m[/latex] units if [latex]0 < m < 1[/latex]. This means the larger the absolute value of [latex]m[/latex], the steeper the slope.
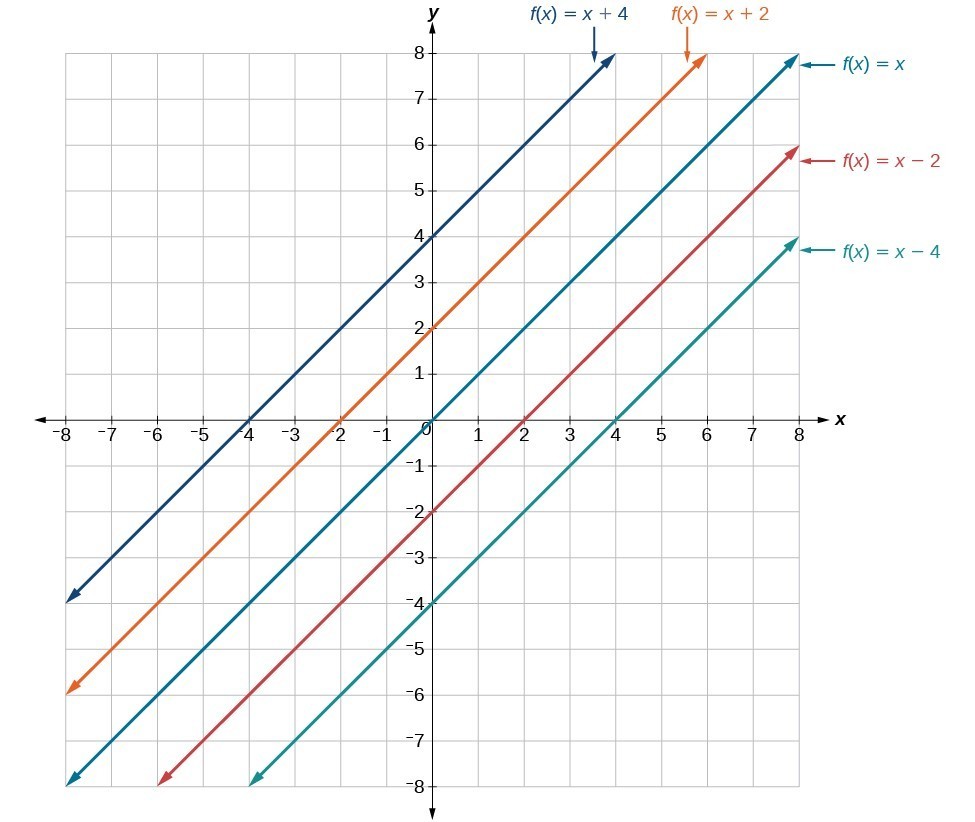
Vertical Shift
In [latex]f\left(x\right)=mx+b[/latex], the [latex]b[/latex] acts as the vertical shift, moving the graph up and down without affecting the slope of the line. Notice that adding a value of [latex]b[/latex] to the equation of [latex]f\left(x\right)=x[/latex] shifts the graph of [latex]f[/latex] a total of [latex]b[/latex] units up if [latex]b[/latex] is positive and [latex]|b|[/latex] units down if [latex]b[/latex] is negative.
Using vertical stretches or compressions along with vertical shifts is another way to look at identifying different types of linear functions. Although this may not be the easiest way to graph this type of function, it is still important to practice each method.
- Graph [latex]f\left(x\right)=x[/latex].
- Vertically stretch or compress the graph by a factor [latex]m[/latex].
- Shift the graph up or down [latex]b[/latex] units.
Graph [latex]f(x)=\frac{1}{2}x - 3[/latex] using transformations.


[latex]\begin{array}{l}f\text{(2)}=\frac{\text{1}}{\text{2}}\text{(2)}-\text{3}\hfill \\ =\text{1}-\text{3}\hfill \\ =-\text{2}\hfill \end{array}[/latex]