Spreadsheet Hands-On: Perform exponential regression on a population growth
As an example, consider the population of the United States. According to the U.S. Census Bureau. There were [latex]242.3[/latex] million people in the country in 1987. By the year 2019 there were [latex]329.9[/latex] million. At what rate was the population growing? A few more data points would be helpful to get a good model. A little research at the Census Bureau website revealed the following population counts, [latex]y[/latex], for years [latex]x[/latex] since 1987.
| x | 0 | 4 | 9 | 13 | 16 | 22 | 23 | 25 | 28 | 31 | 32 |
| y | 242.3 | 253.5 | 269.7 | 282.2 | 290.1 | 306.8 | 309.3 | 314.8 | 321.7 | 328.0 | 329.9 |
Let’s plot this data on a scatterplot in Excel and perform an exponential regression.
The examples shown below will use the Microsoft Excel spreadsheet but you can also use an open source spreadsheet such as Apache OpenOffice Calc or Google Sheets.
Step 1: Store the data in Excel and create a scatterplot and trendline
- Open a new spreadsheet or Excel workbook and make two columns for the population data listed above in columns [latex]B[/latex] and [latex]C[/latex] (leave column [latex]A[/latex] blank for now). You can title column [latex]B[/latex] “yrs after 1987” and column [latex]C[/latex] “population in millions.” Store the data underneath each column heading.
- In column [latex]A[/latex], type the formula ” =1987+B2″ and Enter. Grab the fill handle in the lower right corner of the cell and pull it down to cell [latex]A12[/latex]. This will fill in the actual years that correspond to each input value. Doing this won’t affect the model, but it will make it easier to interpret visually.
- Highlight the data, choose the Insert tab in the ribbon at the top of the window then choose a scatter plot to get the chart.
- Click on the chart, then click the style icon with the plus sign. Mouse-over Trendline and click the right-arrow that appears there. Choose More Options… to open the Format Trendline pane.
- Click the radio button next to Exponential, and click to Display Equation on chart and Display R-squared value on chart.
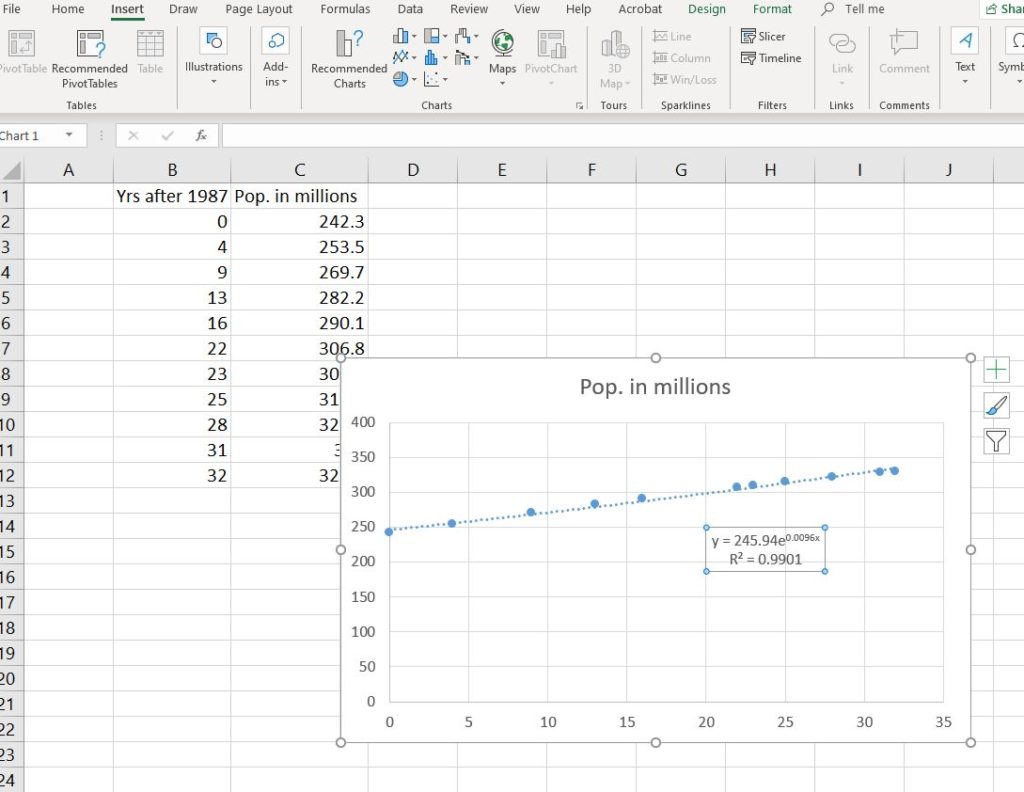
- The exponential function [latex]y=245.94e^{0.0096x}[/latex] appears with a coefficient of determination [latex]r^{2}=0.9901[/latex]. See below for a discussion of the form of this equation.
Step 2: Convert between continuous and exponential growth
The exponential regression obtained in step six above included a base of [latex]e[/latex]. It’s approximately equivalent to [latex]2.718[/latex]. As you learned on the previous page, we can switch between the exponential growth formula and the continuous growth formula. In the above example regarding the population of the U.S., we should be able to rewrite
[latex]y=245.94e^{0.0096x} \qquad \text{ is equivalent to } \qquad 245.94\left(1.0096\right)^{x}[/latex].
In both the explicit form of exponential growth and the continuous form, we see that the growth rate [latex]r=0.0096[/latex], but this is a coincidence. The two rates will not always be the same number. Furthermore, these are not the same formulas, but they are close enough to one another to be able to approximate in the short run.

We see that the value of [latex]r^{2}[/latex] is very close to [latex]1[/latex], which makes this an appropriate model for the data set, with a starting population of [latex]245.94[/latex] million in 1987 and a growth rate of [latex]0.96%[/latex] per year. But is it a good model for the population growth in the U.S. in general? How confident may we be using this model to extrapolate from the data into the future? Remember that extrapolation can be a risky behavior. According to the Census Bureau, the U.S. grew only [latex]0.62%[/latex] from Jan. 1, 2018 until Jan. 1, 2019. But the country experienced annual growth rates over 1% during the 1980s. Certainly, growth rates fluctuate over time. Models only approximate growth in the world; they cannot make factual predictions, but they can help us gain insight.
Step 3: Compare exponential regression to linear regression for the same population
- Click on the chart you built in step 1 above to open the Format Trendline Pane again. This time, choose Linear instead of Exponential. Display the equation and R-squared value.
- Which trendline offered the higher R-squared value?
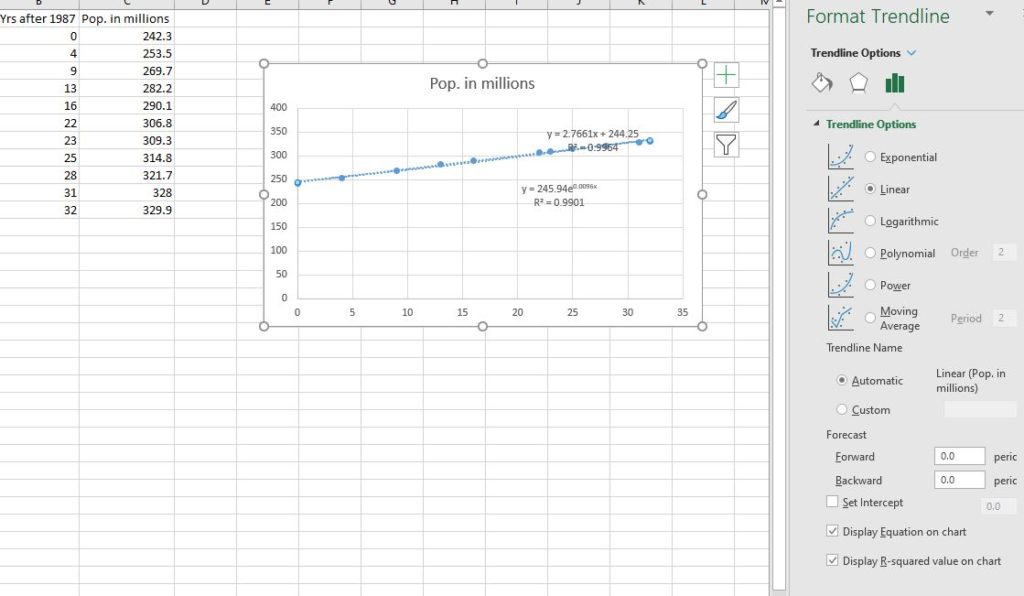
The linear model [latex]y=2.7661x+244.25[/latex] has an [latex]r^{2}[/latex] of [latex]0.9964[/latex], which is higher than the [latex]r^{2}[/latex] for the exponential regression. Does this make the linear trendline a better model for the population growth? In the short-run, for this particular data set, the lineal model is a better fit. Let’s extrapolate our data into the future and see how many people each model predicts will inhabit the U.S. in the year 2045.

Step 4: Use a model to make a prediction
The calculations we need to make predictions can be done in a spreadsheet or on a calculator. Follow the steps below to see how to use Excel to predict the population in the year 2045, which is [latex]58[/latex] years after 1987. We need to substitute [latex]58[/latex] for [latex]x[/latex] in each model and see what it predicts.
- Choose any blank cell to use as a calculator.
- To calculate the linear model, type =2.766*58+244.25 and Enter. You should obtain [latex]404.678[/latex] million people in the year 2045 in the U.S.
- To calculate the exponential model, you’ll need to use Excel’s EXP function. It raises the base of e (which is a number approximately equal to [latex]2.718[/latex]) to a number. Type =245.94*EXP(0.0096*58) and Enter. You should obtain [latex]429.1848[/latex] million people in the year 2045 in the U.S.
Which of these numbers is the correct prediction? It is impossible to know. Modeling well involves a skillful mixture of accurate math, insight into the situation, and certainly some educated guessing. But generally, we would use an exponential model to approximate population in the short run and a logistic model in the long run. We’ll look at the logistic model in the next section.