We just saw that the vertical shift is a change to the output, or outside, of the function. We will now look at how changes to input, on the inside of the function, change its graph and meaning. A shift to the input results in a movement of the graph of the function left or right in what is known as a horizontal shift.
horizontal shift
A horizontal shift occurs when you add or subtract a constant value to the input [latex]x[/latex] of the function [latex]f(x)[/latex].
This shifts the graph of the function horizontally.
Rightward shift: If you subtract a constant [latex]c[/latex] from [latex]x[/latex] before applying the function [latex]f[/latex], the graph of the function shifts to the right by [latex]c[/latex] units.
[latex]g(x) = f(x-c)[/latex]
Leftward shift: If you add a constant [latex]c[/latex] to [latex]x[/latex] before applying the function [latex]f[/latex], the graph of the function shifts to the left by [latex]c[/latex] units.
[latex]h(x) = f(x+c)[/latex]
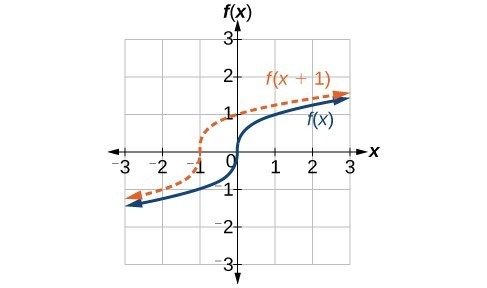
The image shows the graph of the cube root function [latex]f(x) = \sqrt[3]{x}[/latex] (solid blue line) and its horizontally shifted version [latex]f(x + 1)[/latex] (dashed orange line).
Graph of f(x) and f(x) + 1
Original Function [latex]f(x)[/latex]
The solid blue curve represents the original function [latex]\sqrt[3]{x}[/latex].
The function [latex]f(x)[/latex] passes through the origin [latex](0,0)[/latex] because [latex]\sqrt[3]{0} = 0[/latex].
Horizontally Shifted Function [latex]f(x+1)[/latex]
The dashed orange curve represents the function [latex]f(x+1) = \sqrt[3]{x+1}[/latex].
Each point on the graph of [latex]f(x+1)[/latex] is exactly [latex]1[/latex] unit to the left of the corresponding point on the graph of [latex]f(x)[/latex].
For example:
If [latex]x=0[/latex], then [latex]\sqrt[3]{0+1} = \sqrt[3]{1} = 1[/latex].
If [latex]x=-2[/latex], then [latex]\sqrt[3]{-2+1} = \sqrt[3]{-1} = -1[/latex].
A horizontal shift involves moving the graph of a function left or right without altering its shape. In this case, adding [latex]1[/latex] to the input of the function [latex]f(x) = \sqrt[3]{x}[/latex] results in a horizontal shift of the graph to the left by [latex]1[/latex] unit.
A function [latex]f\left(x\right)[/latex] is given below. Create a table for the function [latex]g\left(x\right)=f\left(x - 3\right)[/latex].
[latex]x[/latex]
2
4
6
8
[latex]f\left(x\right)[/latex]
1
3
7
11
The formula [latex]g\left(x\right)=f\left(x - 3\right)[/latex] tells us that the output values of [latex]g[/latex] are the same as the output value of [latex]f[/latex] when the input value is 3 less than the original value. For example, we know that [latex]f\left(2\right)=1[/latex]. To get the same output from the function [latex]g[/latex], we will need an input value that is 3 larger. We input a value that is 3 larger for [latex]g\left(x\right)[/latex] because the function takes 3 away before evaluating the function [latex]f[/latex].
We continue with the other values to create this table.
[latex]x[/latex]
5
7
9
11
[latex]x - 3[/latex]
2
4
6
8
[latex]f\left(x\right)[/latex]
1
3
7
11
[latex]g\left(x\right)[/latex]
1
3
7
11
The result is that the function [latex]f\left(x\right)[/latex] has been shifted to the right by 3. Notice the output values for [latex]g\left(x\right)[/latex] remain the same as the output values for [latex]f\left(x\right)[/latex], but the corresponding input values, [latex]x[/latex], have shifted to the right by 3. Specifically, 2 shifted to 5, 4 shifted to 7, 6 shifted to 9, and 8 shifted to 11.
Analysis of the Solution
The graph below represents both of the functions. We can see the horizontal shift in each point.
Graph of the points from the previous table for f(x) and g(x)=f(x-3)
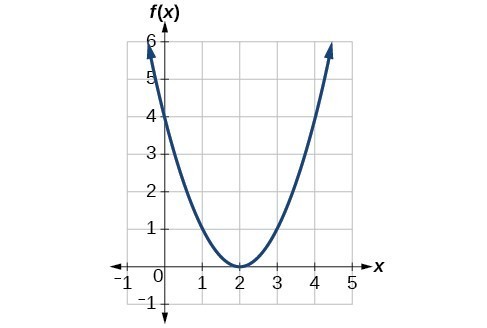
The graph below represents a transformation of the toolkit function [latex]f\left(x\right)={x}^{2}[/latex]. Relate this new function [latex]g\left(x\right)[/latex] to [latex]f\left(x\right)[/latex], and then find a formula for [latex]g\left(x\right)[/latex].
Graph of f(x)
Notice that the graph is identical in shape to the [latex]f\left(x\right)={x}^{2}[/latex] function, but the [latex]x[/latex]–values are shifted to the right 2 units. The vertex used to be at (0,0), but now the vertex is at (2,0). The graph is the basic quadratic function shifted 2 units to the right, so
Notice how we must input the value [latex]x=2[/latex] to get the output value [latex]y=0[/latex]; the [latex]x[/latex]-values must be 2 units larger because of the shift to the right by 2 units. We can then use the definition of the [latex]f\left(x\right)[/latex] function to write a formula for [latex]g\left(x\right)[/latex] by evaluating [latex]f\left(x - 2\right)[/latex].
To determine whether the shift is [latex]+2[/latex] or [latex]-2[/latex] , consider a single reference point on the graph. For a quadratic, looking at the vertex point is convenient. In the original function, [latex]f\left(0\right)=0[/latex]. In our shifted function, [latex]g\left(2\right)=0[/latex]. To obtain the output value of 0 from the function [latex]f[/latex], we need to decide whether a plus or a minus sign will work to satisfy [latex]g\left(2\right)=f\left(x - 2\right)=f\left(0\right)=0[/latex]. For this to work, we will need to subtract 2 units from our input values.
The function [latex]G\left(m\right)[/latex] gives the number of gallons of gas required to drive [latex]m[/latex] miles. Interpret [latex]G\left(m\right)+10[/latex] and [latex]G\left(m+10\right)[/latex].
[latex]G\left(m\right)+10[/latex] can be interpreted as adding [latex]10[/latex] to the output, gallons. This is the gas required to drive [latex]m[/latex] miles, plus another [latex]10[/latex] gallons of gas. The graph would indicate a vertical shift.[latex]G\left(m+10\right)[/latex] can be interpreted as adding [latex]10[/latex]to the input, miles. So this is the number of gallons of gas required to drive [latex]10[/latex] miles more than [latex]m[/latex] miles. The graph would indicate a horizontal shift.