Systems of Nonlinear Equations and Inequalities: Learn It 4
Graphing a System of Nonlinear Inequalities
Now that we have learned to graph nonlinear inequalities, we can learn how to graph systems of nonlinear inequalities. A system of nonlinear inequalities is a system of two or more inequalities in two or more variables containing at least one inequality that is not linear.
Graphing a system of nonlinear inequalities is similar to graphing a system of linear inequalities. The difference is that our graph may result in more shaded regions that represent a solution than we find in a system of linear inequalities. The solution to a nonlinear system of inequalities is the region of the graph where the shaded regions of the graph of each inequality overlap, or where the regions intersect, called the feasible region.
How To: Given a system of nonlinear inequalities, sketch a graph.
Find the intersection points by solving the corresponding system of nonlinear equations.
Graph the nonlinear equations.
Find the shaded regions of each inequality.
Identify the feasible region as the intersection of the shaded regions of each inequality or the set of points common to each inequality.
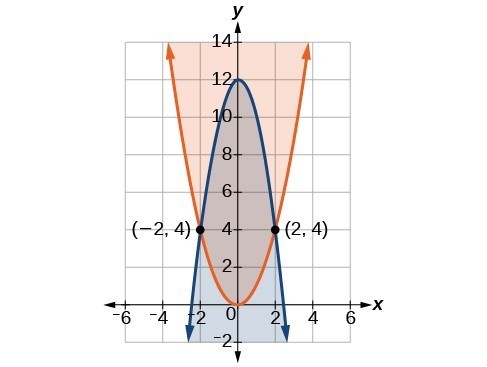
These two equations are clearly parabolas. We can find the points of intersection by the elimination process: Add both equations and the variable [latex]y[/latex] will be eliminated. Then we solve for [latex]x[/latex].
The two points of intersection are [latex]\left(2,4\right)[/latex] and [latex]\left(-2,4\right)[/latex]. Notice that the equations can be rewritten as follows.
[latex]\begin{align}{x}^{2}-y&\le 0 \\ {x}^{2}&\le y \\ y&\ge {x}^{2}\end{align}[/latex]
Graph each inequality. The feasible region is the region between the two equations bounded by [latex]2{x}^{2}+y\le 12[/latex] on the top and [latex]{x}^{2}-y\le 0[/latex] on the bottom.