- Find solutions to systems of equations by drawing their graphs and finding where they cross
- Solve systems of equations by replacing one variable with an expression from another equation
- Solve systems of equations by adding equations to eliminate a variable
- Figure out when systems of equations have no solution or infinitely many solutions
Writing and Solving a System of Equations in Two Variables
Now that we’ve learned all about systems of equations, it’s time to put that knowledge to use! Sometimes, we need to develop our own equations to solve real-world problems.
- Identify the Situation: Think about a real-world scenario where you need to find two unknown quantities. This could be anything from planning a party to budgeting for groceries.
- Pick Your Variables: Choose two variables to represent the unknown quantities. Let’s call them [latex]x[/latex] and [latex]y[/latex]. Note: You don’t always need to pick [latex]x[/latex] and [latex]y[/latex].
- Create Your Equations: Write two equations based on the scenario. Each equation should represent a different relationship between [latex]x[/latex] and [latex]y[/latex].
- Choose a Method to Solve: Decide which method you want to use to solve the system:
- Substitution: Solve one equation for one variable, then substitute that into the other equation.
- Elimination: Add or subtract the equations to eliminate one variable.
- Graphing: Draw both equations on a graph and see where they intersect.
- Solve the System: Use your chosen method to find the values of [latex]x[/latex] and [latex]y[/latex] that make both equations true.
- Interpret the Solution: Look at the values you found. What do they mean in the context of your scenario? If there is no solution or infinitely many solutions, explain why that happens.
Using Systems of Equations to Investigate Profits
Using what we have learned about systems of equations, we can return to the skateboard manufacturing problem at the beginning of the section. The skateboard manufacturer’s revenue function is the function used to calculate the amount of money that comes into the business. It can be represented by the equation [latex]R=xp[/latex], where [latex]x=[/latex] quantity and [latex]p=[/latex] price. The revenue function is shown in orange in the graph below.
The cost function is the function used to calculate the costs of doing business. It includes fixed costs, such as rent and salaries, and variable costs, such as utilities. The cost function is shown in blue in the graph below. The [latex]x[/latex] -axis represents quantity in hundreds of units. The [latex]y[/latex]-axis represents either cost or revenue in hundreds of dollars.
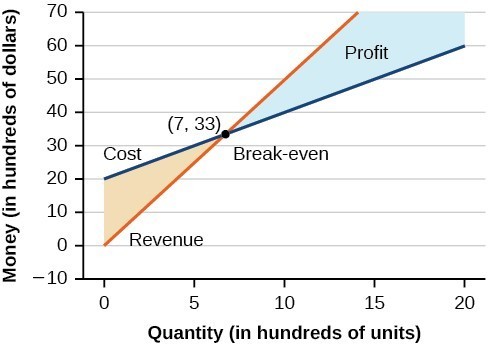
The point at which the two lines intersect is called the break-even point. We can see from the graph that if [latex]700[/latex] units are produced, the cost is [latex]$3,300[/latex] and the revenue is also [latex]$3,300[/latex]. In other words, the company breaks even if they produce and sell [latex]700[/latex] units. They neither make money nor lose money.
The shaded region to the right of the break-even point represents quantities for which the company makes a profit. The shaded region to the left represents quantities for which the company suffers a loss. The profit function is the revenue function minus the cost function, written as [latex]P\left(x\right)=R\left(x\right)-C\left(x\right)[/latex]. Clearly, knowing the quantity for which the cost equals the revenue is of great importance to businesses.


Using Systems of Equations in Application

- Rates retrieved Aug 2, 2010 from http://www.budgettruck.com and http://www.uhaul.com/ ↵