Graphing Rational Functions
Previously we saw that the numerator of a rational function reveals the [latex]x[/latex]-intercepts of the graph, whereas the denominator reveals the vertical asymptotes of the graph. As with polynomials, factors of the numerator may have integer powers greater than one. Fortunately, the effect on the shape of the graph at those intercepts is the same as we saw with polynomials.
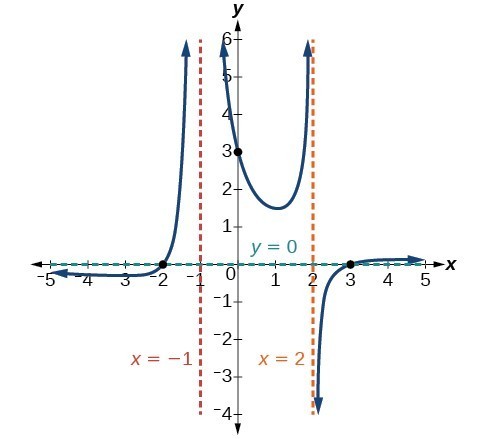
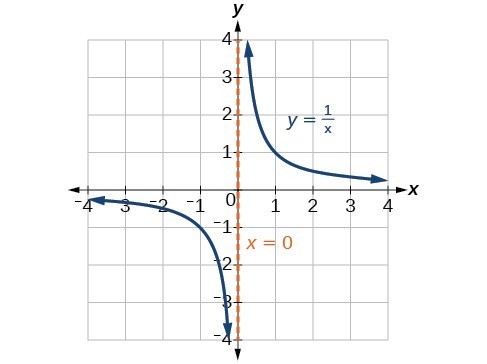
The vertical asymptotes associated with the factors of the denominator will mirror one of the two toolkit reciprocal functions. When the degree of the factor in the denominator is odd, the distinguishing characteristic is that on one side of the vertical asymptote the graph heads towards positive infinity, and on the other side the graph heads towards negative infinity.
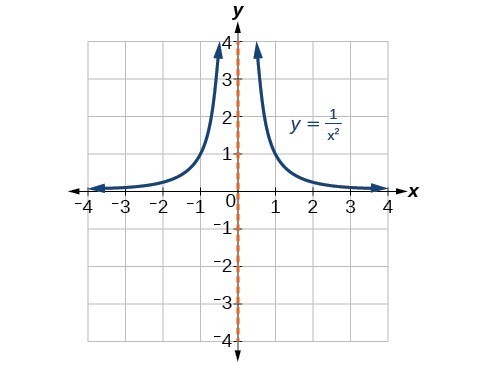
When the degree of the factor in the denominator is even, the distinguishing characteristic is that the graph either heads toward positive infinity on both sides of the vertical asymptote or heads toward negative infinity on both sides.
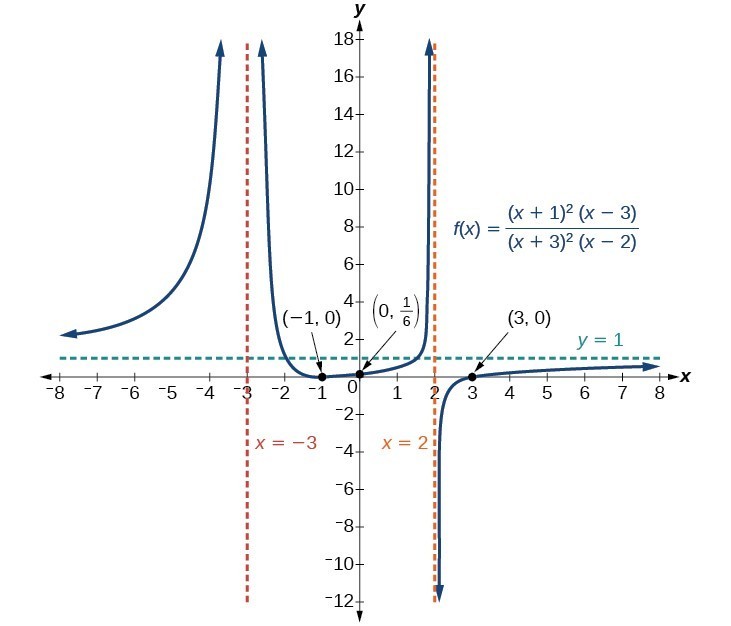
- At the [latex]x[/latex]-intercept [latex]x=-1[/latex] corresponding to the [latex]{\left(x+1\right)}^{2}[/latex] factor of the numerator, the graph bounces, consistent with the quadratic nature of the factor.
- At the [latex]x[/latex]-intercept [latex]x=3[/latex] corresponding to the [latex]\left(x - 3\right)[/latex] factor of the numerator, the graph passes through the axis as we would expect from a linear factor.
- At the vertical asymptote [latex]x=-3[/latex] corresponding to the [latex]{\left(x+3\right)}^{2}[/latex] factor of the denominator, the graph heads towards positive infinity on both sides of the asymptote, consistent with the behavior of the function [latex]f\left(x\right)=\frac{1}{{x}^{2}}[/latex].
- At the vertical asymptote [latex]x=2[/latex], corresponding to the [latex]\left(x - 2\right)[/latex] factor of the denominator, the graph heads towards positive infinity on the left side of the asymptote and towards negative infinity on the right side, consistent with the behavior of the function [latex]f\left(x\right)=\frac{1}{x}[/latex].
- Simplify the Function: If possible, simplify the rational function by factoring and reducing common factors in the numerator and denominator.
- Find the Domain: Determine the values of [latex]x[/latex] for which the function is undefined (i.e., where the denominator equals zero). These values will help identify vertical asymptotes and holes.
- Identify Vertical Asymptotes and Holes:
- Set the denominator equal to zero and solve for [latex]x[/latex]. These [latex]x[/latex]-values indicate potential vertical asymptotes.
- Check if the numerator is also zero at these [latex]x[/latex]-values. If both the numerator and denominator are zero, then you have a hole (removable discontinuity), not a vertical asymptote.
- Find the Horizontal or Slant Asymptote: Compare the degrees of the numerator and denominator:
- If the degree of the numerator is less than the degree of the denominator, the horizontal asymptote is [latex]y = 0[/latex].
- If the degrees are equal, the horizontal asymptote is [latex]y = \frac{a}{b}[/latex], where [latex]a[/latex] and [latex]b[/latex] are the leading coefficients of the numerator and denominator, respectively.
- If the degree of the numerator is greater than the degree of the denominator by one, there is a slant asymptote. Use polynomial long division or synthetic dvision to find the equation of the slant asymptote.
- Find the Intercepts:
- [latex]x[/latex]-intercepts: Set the numerator equal to zero and solve for [latex]x[/latex].
- [latex]y[/latex]-intercept: Set [latex]x= 0[/latex] and solve for [latex]y[/latex].
- Plot Key Points: Calculate and plot several points on either side of the vertical asymptotes to get an idea of the function’s behavior, if needed.
- Sketch the Graph:
- Draw the asymptotes as dashed lines.
- Plot the intercepts and key points.
- Draw the curve, making sure it approaches the asymptotes appropriately.
[latex]f\left(x\right)=\dfrac{\left(x+2\right)\left(x - 3\right)}{{\left(x+1\right)}^{2}\left(x - 2\right)}[/latex]