Graphing Transformations of Logarithmic Functions Cont.
Graphing Stretches and Compressions of [latex]y=\text{log}_{b}\left(x\right)[/latex]
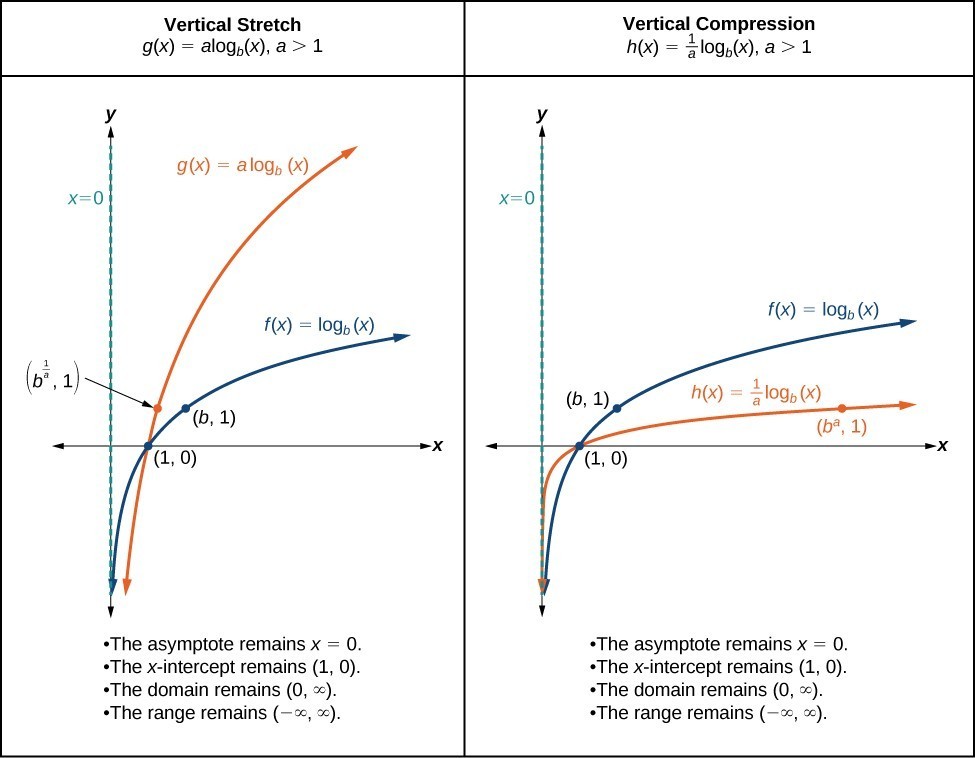
When the parent function [latex]f\left(x\right)={\mathrm{log}}_{b}\left(x\right)[/latex] is multiplied by a constant [latex]a > 0[/latex], the result is a vertical stretch or compression of the original graph. To visualize stretches and compressions, we set [latex]a > 1[/latex] and observe the general graph of the parent function [latex]f\left(x\right)={\mathrm{log}}_{b}\left(x\right)[/latex] alongside the vertical stretch, [latex]g\left(x\right)=a{\mathrm{log}}_{b}\left(x\right)[/latex], and the vertical compression, [latex]h\left(x\right)=\frac{1}{a}{\mathrm{log}}_{b}\left(x\right)[/latex].
- Both the vertical stretch and compression produce graphs that are increasing. Which transformation produces a function that increases faster?
- One of the key points that is commonly defined for transformations of a logarithmic function comes from finding the input that gives an output of [latex]y = 1[/latex]. This point can help you determine whether a graph is the result of a vertical compression or stretch. Explain why.
The graphs below summarize the key features of the resulting graphs of vertical stretches and compressions of logarithmic functions.
vertical stretches and compressions of the parent function [latex]y=\text{log}_{b}\left(x\right)[/latex]
For any constant [latex]a > 1[/latex], the function [latex]f\left(x\right)=a{\mathrm{log}}_{b}\left(x\right)[/latex]
- stretches the parent function [latex]y={\mathrm{log}}_{b}\left(x\right)[/latex] vertically by a factor of [latex]a[/latex] if [latex]a > 1[/latex].
- compresses the parent function [latex]y={\mathrm{log}}_{b}\left(x\right)[/latex] vertically by a factor of [latex]a[/latex] if [latex]0 < a < 1[/latex].
- has the vertical asymptote [latex]x = 0[/latex].
- has the [latex]x[/latex]-intercept [latex]\left(1,0\right)[/latex].
- has domain [latex]\left(0,\infty \right)[/latex].
- has range [latex]\left(-\infty ,\infty \right)[/latex].
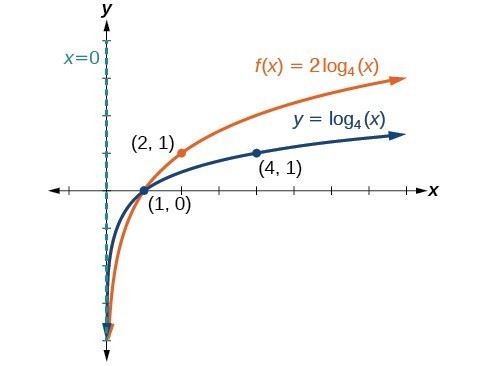
- Identify the vertical stretch or compression:
- If [latex]|a|>1[/latex], the graph of [latex]f\left(x\right)={\mathrm{log}}_{b}\left(x\right)[/latex] is stretched by a factor of [latex]a[/latex] units.
- If [latex]|a|<1[/latex], the graph of [latex]f\left(x\right)={\mathrm{log}}_{b}\left(x\right)[/latex] is compressed by a factor of [latex]a[/latex] units.
- Draw the vertical asymptote [latex]x = 0[/latex].
- Identify three key points from the parent function. Find new coordinates for the shifted functions by multiplying the [latex]y[/latex] coordinates in each point by [latex]a[/latex].
- Label the three points.
- The domain is [latex]\left(0,\infty \right)[/latex], the range is [latex]\left(-\infty ,\infty \right)[/latex], and the vertical asymptote is [latex]x = 0[/latex].
Graphing Reflections of [latex]f\left(x\right)={\mathrm{log}}_{b}\left(x\right)[/latex]
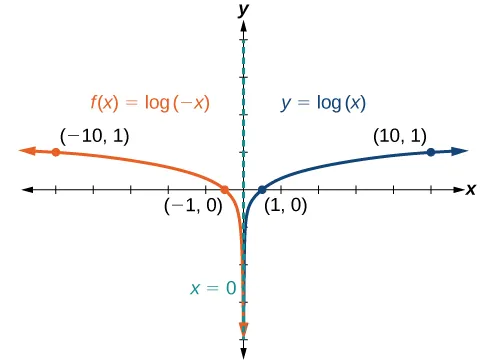
When the parent function [latex]f\left(x\right)={\mathrm{log}}_{b}\left(x\right)[/latex] is multiplied by [latex]–1[/latex], the result is a reflection about the [latex]x[/latex]-axis. When the input is multiplied by [latex]–1[/latex], the result is a reflection about the [latex]y[/latex]-axis. To visualize reflections, we restrict [latex]b > 1[/latex] and observe the general graph of the parent function [latex]f\left(x\right)={\mathrm{log}}_{b}\left(x\right)[/latex] alongside the reflection about the [latex]x[/latex]-axis, [latex]g\left(x\right)={\mathrm{-log}}_{b}\left(x\right)[/latex], and the reflection about the [latex]y[/latex]-axis, [latex]h\left(x\right)={\mathrm{log}}_{b}\left(-x\right)[/latex].
- Which graph, [latex]g(x) = -\log_{b}{x} \text{ or }h(x) = \log_{b}({-x})[/latex] represents a vertical reflection? Which one represents a horizontal reflection?
- You already added the point [latex](b,1)[/latex] as a point of interest for the function [latex]f(x)[/latex]. Using the variable [latex]b[/latex] as your [latex]x[/latex] value, add the corresponding points of interest for [latex]g(x)\text{ and }h(x)[/latex].
- Does the vertical asymptote change when you reflect the graph of [latex]f(x)[/latex] either vertically or horizontally?
The graphs below summarize the key characteristics of reflecting [latex]f(x) = \log_{b}{x}[/latex] horizontally and vertically.
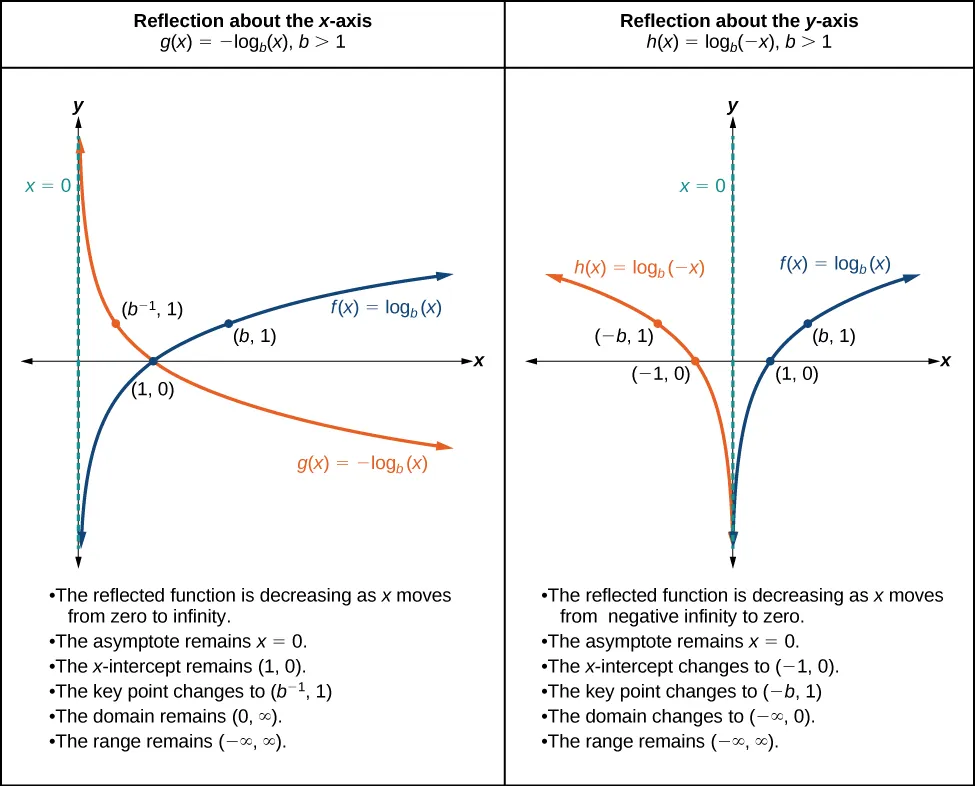
reflections of the parent function [latex]y=\text{log}_{b}\left(x\right)[/latex]
The function [latex]f\left(x\right)={\mathrm{-log}}_{b}\left(x\right)[/latex]
- reflects the parent function [latex]y={\mathrm{log}}_{b}\left(x\right)[/latex] about the [latex]x[/latex]-axis.
- has domain [latex]\left(0,\infty \right)[/latex], range, [latex]\left(-\infty ,\infty \right)[/latex], and vertical asymptote [latex]x = 0[/latex] which are unchanged from the parent function.
The function [latex]f\left(x\right)={\mathrm{log}}_{b}\left(-x\right)[/latex]
- reflects the parent function [latex]y={\mathrm{log}}_{b}\left(x\right)[/latex] about the [latex]y[/latex]-axis.
- has domain [latex]\left(-\infty ,0\right)[/latex].
- has range [latex]\left(-\infty ,\infty \right)[/latex] and vertical asymptote [latex]x = 0[/latex] which are unchanged from the parent function.
| [latex]\text{If }f\left(x\right)=-{\mathrm{log}}_{b}\left(x\right)[/latex] | [latex]\text{If }f\left(x\right)={\mathrm{log}}_{b}\left(-x\right)[/latex] |
|---|---|
| 1. Draw the vertical asymptote, [latex]x = 0[/latex]. | 1. Draw the vertical asymptote, [latex]x = 0[/latex]. |
| 2. Plot the x-intercept, [latex]\left(1,0\right)[/latex]. | 2. Plot the x-intercept, [latex]\left(1,0\right)[/latex]. |
| 3. Reflect the graph of the parent function [latex]f\left(x\right)={\mathrm{log}}_{b}\left(x\right)[/latex] about the [latex]x[/latex]-axis. | 3. Reflect the graph of the parent function [latex]f\left(x\right)={\mathrm{log}}_{b}\left(x\right)[/latex] about the [latex]y[/latex]-axis. |
| 4. Draw a smooth curve through the points. | 4. Draw a smooth curve through the points. |
| 5. State the domain [latex]\left(0,\infty \right)[/latex], the range [latex]\left(-\infty ,\infty \right)[/latex], and the vertical asymptote [latex]x = 0[/latex]. | 5. State the domain, [latex]\left(-\infty ,0\right)[/latex], the range, [latex]\left(-\infty ,\infty \right)[/latex], and the vertical asymptote [latex]x = 0[/latex]. |