- Identify the domain of a logarithmic function
- Graph logarithmic functions
Domain of Logarithmic Functions
The Main Idea
- Basic Domain Rule:
- For [latex]y = \log_b(x)[/latex], the domain is [latex](0, \infty)[/latex]
- The argument of a logarithm must be positive
- Vertical Asymptote:
- Logarithmic functions have a vertical asymptote at [latex]x = 0[/latex]
- Inverse Relationship:
- Domain of [latex]\log_b(x)[/latex] is the range of [latex]b^x[/latex]
- Range of [latex]\log_b(x)[/latex] is the domain of [latex]b^x[/latex]
- Transformations:
- Can change the domain of the parent function
- Always ensure the argument remains positive
- Finding Domains:
- Set up inequality: [latex]\text{ argument }> 0[/latex]
- Solve for [latex]x[/latex]
- Express domain in interval notation
You can view the transcript for “Ex: Find the Domain of Logarithmic Functions” here (opens in new window).
Graphing a Logarithmic Function Using a Table of Values
The Main Idea
- Parent Function:
- [latex]f(x) = \log_b(x)[/latex] where [latex]b > 0[/latex] and [latex]b \neq 1[/latex]
- Inverse Relationship:
- Logarithmic functions are inverses of exponential functions
- Their graphs are reflections of each other across [latex]y = x[/latex]
- Key Characteristics:
- Domain: [latex](0, \infty)[/latex]
- Range: [latex](-\infty, \infty)[/latex]
- Vertical asymptote: [latex]x = 0[/latex]
- [latex]x[/latex]-intercept: [latex](1, 0)[/latex]
- Key point: [latex](b, 1)[/latex]
- Behavior:
- Increasing if [latex]b > 1[/latex]
- Decreasing if [latex]0 < b < 1[/latex]
- Graph Shape:
- Starts at vertical asymptote [latex]x = 0[/latex]
- Passes through [latex](1, 0)[/latex] and [latex](b, 1)[/latex]
- Curves upward ([latex]b > 1[/latex]) or downward ([latex]0 < b < 1[/latex])
You can view the transcript for “Ex: Graph an Exponential Function and Logarithmic Function” here (opens in new window).
You can view the transcript for “Ex 1: Match Graphs with Exponential and Logarithmic Functions” here (opens in new window).
Graphing Transformations of Logarithmic Functions
The Main Idea
- Parent Function:
- [latex]f(x) = \log_b(x)[/latex] where [latex]b > 0[/latex] and [latex]b \neq 1[/latex]
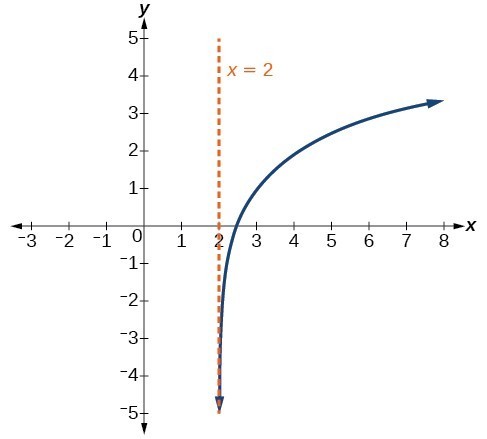
- Horizontal Shifts:
- [latex]f(x) = \log_b(x + c)[/latex]
- Shifts left [latex]c[/latex] units if [latex]c > 0[/latex]
- Shifts right [latex]c[/latex] units if [latex]c < 0[/latex]
- Vertical asymptote: [latex]x = -c[/latex]
- Domain: [latex](-c, \infty)[/latex]
- Range: [latex](-\infty, \infty)[/latex]
- Vertical Shifts:
- [latex]f(x) = \log_b(x) + d[/latex]
- Shifts up [latex]d[/latex] units if [latex]d > 0[/latex]
- Shifts down [latex]d[/latex] units if [latex]d < 0[/latex]
- Vertical asymptote: [latex]x = 0[/latex]
- Domain: [latex](0, \infty)[/latex]
- Range: [latex](-\infty, \infty)[/latex]
- Effect on Domain and Range:
- Horizontal shifts affect domain
- Vertical shifts do not affect domain or range
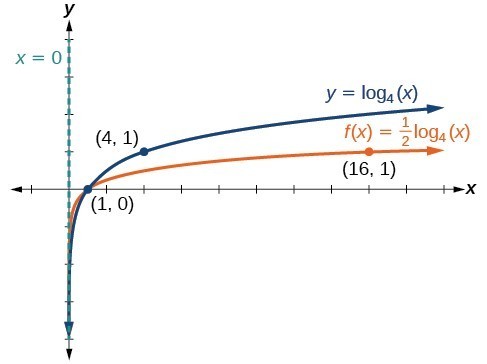
- Vertical Stretches and Compressions:
- [latex]f(x) = a\log_b(x)[/latex], where [latex]a > 0[/latex]
- Stretch if [latex]a > 1[/latex], compress if [latex]0 < a < 1[/latex]
- Vertical asymptote: [latex]x = 0[/latex] (unchanged)
- Domain: [latex](0, \infty)[/latex] (unchanged)
- Range: [latex](-\infty, \infty)[/latex] (unchanged)
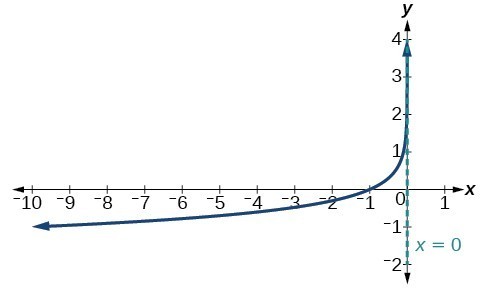
- Reflections:
- About [latex]x[/latex]-axis: [latex]f(x) = -\log_b(x)[/latex]
- Domain: [latex](0, \infty)[/latex], Range: [latex](-\infty, \infty)[/latex] (unchanged)
- About [latex]y[/latex]-axis: [latex]f(x) = \log_b(-x)[/latex]
- Domain: [latex](-\infty, 0)[/latex], Range: [latex](-\infty, \infty)[/latex]
- About [latex]x[/latex]-axis: [latex]f(x) = -\log_b(x)[/latex]
- Combined Transformations:
- Can involve multiple operations (e.g., [latex]f(x) = a\log_b(x-h) + k[/latex])
- Apply transformations in the correct order: inside parentheses first, then outside
- Vertical Asymptote:
- [latex]x = 0[/latex] for parent function
- Shifts with horizontal transformations


You can view the transcript for “How to graph a logarithmic function with horizontal shift” here (opens in new window).
You can view the transcript for “Graph a logarithmic function with multiple transformations” here (opens in new window).
You can view the transcript for “Logarithmic Function Graph Stretch and Compression Shifts/Transformations” here (opens in new window).
You can view the transcript for “Learn how to graph a logarithm with reflections over x and y axis” here (opens in new window).