- Define what a function is and apply the vertical line test to identify functions
- Use function notation to represent and evaluate functions
- Recognize the graphs of fundamental toolkit functions
Determining Whether a Relation Represents a Function
The Main Idea
A function is like a magical box that takes something in and spits something else out. In math terms, it’s a special relationship where each input (or “independent variable”) is connected to exactly one output (or “dependent variable”). So, if you feed the function a number, it will give you back another number, but it won’t ever get confused and give you two or more numbers for the same input.
- Input: Also known as the independent variable, often labeled [latex]x[/latex].
- Output: Also known as the dependent variable, often labeled [latex]y[/latex].
- Domain: The set of all possible inputs.
- Range: The set of all possible outputs.
How to: Given a relationship between two quantities, determine whether the relationship is a function.
- Identify the input values.
- Identify the output values.
- If each input value leads to only one output value, classify the relationship as a function. If any input value leads to two or more outputs, do not classify the relationship as a function.
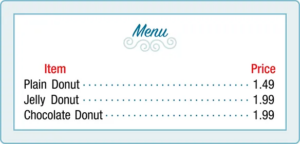
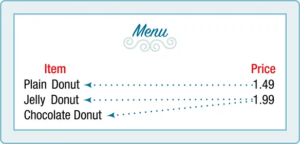
- Is price a function of the item?
- Is the item a function of the price?

[latex]\{(−3, 4),(−2, 4),( −1, 4),(2, 4),(3, 4)\}[/latex]
Verifying a Function Using the Vertical Line Test
The Main Idea
The vertical line test is a quick way to determine if a graph represents a function. If any vertical line intersects the graph more than once, it’s not a function.
When you’re looking at a graph and wondering if it represents a function, try imagining or drawing vertical lines across the graph. If any of these lines touch the graph at more than one point, then what you’re looking at isn’t a function.
For more examples of the vertical line test, watch the following video.
You can view the transcript for “Ex 1: Use the Vertical Line Test to Determine if a Graph Represents a Function” here (opens in new window).
Determining Whether a Function is One-to-One
The Main Idea
A function is one-to-one if each output corresponds to exactly one input. This ensures that the function has a unique inverse.
Think of a one-to-one function like a VIP list at a party. Each name on the list gets you one, and only one, ticket in. No name repeats, and no ticket can be used twice.
For an overview of one-to-one functions, watch the following video.
You can view the transcript for “Overview of one to one functions” here (opens in new window).
The Horizontal Line Test
The Main Idea
To check if a function is one-to-one, use the horizontal line test. If any horizontal line intersects the graph more than once, the function is not one-to-one.
Similar to the vertical line test, but this time you’re drawing horizontal lines. If any line touches the graph more than once, the function isn’t one-to-one, meaning it doesn’t have a unique inverse.
For more examples of the horizontal line test, watch the following video.
You can view the transcript for “Ex 1: Determine if the Graph of a Relation is a One-to-One Function” here (opens in new window).
Representing Functions Using Tables
The Main Idea
How to: Given a table of input and output values, determine whether the table represents a function.
- Identify the input and output values.
- Check to see if each input value is paired with only one output value. If so, the table represents a function.
Function Notation
The Main Idea
Function Notation: The function is often denoted as [latex]f(x)[/latex], where [latex]x[/latex] is the input and [latex]f(x)[/latex] is the output. This notation is a shorthand way of saying “the function [latex]f[/latex] acting on [latex]x[/latex] gives [latex]f(x)[/latex].”
Independent and Dependent Variables: In function notation, [latex]x[/latex] is the independent variable (the input), and [latex]f(x)[/latex] is the dependent variable (the output). The output depends on what you put in as the input.
Flexibility in Naming: Function notation allows you to use different names like [latex]f(x)[/latex], [latex]g(x)[/latex], or [latex]c(x)[/latex] to distinguish between multiple functions. Functions can have inputs that are not just numbers. For example, the input could be the name of a month, and the output could be the number of days in that month.
In the following videos we show two more examples of how to express a relationship using function notation.
You can view the transcript for “Ex: Function Notation Application Problem” here (opens in new window).
You can view the transcript for “Function Notation Application” here (opens in new window).
Finding Input and Output Values of a Function
Evaluation of Functions in Algebraic Forms
The Main Idea
Evaluating Functions: To evaluate a function, substitute the given input into the function’s formula and perform the calculations. For example, if [latex]f(x)=x^2−8[/latex], and you want to find [latex]f(−3)[/latex], you’d calculate [latex](−3)^2−8=1[/latex].
Solving for Input: If you know the output and want to find the input, set the output equal to the function’s formula and solve for the input. For instance, if [latex]h(p)=p^2+2p[/latex] and [latex]h(p)=3[/latex], you’d solve the equation [latex]p^2+2p=3[/latex] to find the value of [latex]p[/latex].
Watch the video below for more examples of evaluating a function for specific values of the input.
You can view the transcript for “Evaluating Functions Using Function Notation (L9.3)” here (opens in new window).
The next video shows another example of how to solve a function.
You can view the transcript for “Ex: Find Function Inputs for a Given Quadratic Function Output” here (opens in new window).
Evaluating a Function Given in Tabular Form
The Main Idea
Functions can be represented in tables, which can be particularly useful when equations are not the best fit.
The domain is the type of input, and the range is the output, often a real number.
To find the output for a given input, look for the input in the table and identify the corresponding output.
To find the input for a given output, scan the output column and note all instances of that output, then find the corresponding input(s).
| [latex]n[/latex] | [latex]1[/latex] | [latex]2[/latex] | [latex]3[/latex] | [latex]4[/latex] | [latex]5[/latex] |
| [latex]g(n)[/latex] | [latex]8[/latex] | [latex]6[/latex] | [latex]7[/latex] | [latex]6[/latex] | [latex]8[/latex] |
You can view the transcript for “Ex: Evaluate a Function and Solve for a Function Value Given a Table” here (opens in new window).
Finding Function Values from a Graph
The Main Idea
Graphs can also be used to evaluate functions.
The graph represents a set of ordered pairs [latex](x,y)[/latex] or [latex](x,f(x))[/latex], where [latex]x[/latex] is the input and [latex]f(x)[/latex] is the output.
Watch the following video for more on finding function values given a graph.
You can view the transcript for “Ex 1: Determine a Function Value From a Graph” here (opens in new window).
Identifying Basic Toolkit Functions
The Main Idea
In this section, we dive into the world of “Toolkit Functions.” Think of these as the ABCs of functions—your go-to set of basic functions that you’ll encounter throughout your studies. These toolkit functions come in various shapes and forms, from simple constant functions to more complex cube root functions. Knowing these functions by heart, including their graphs and equations, will give you a solid foundation for understanding more complex functions later on.
| Toolkit Functions | ||
|---|---|---|
| Name | Function | Graph |
| Constant | [latex]f\left(x\right)=c[/latex], where [latex]c[/latex] is a constant |
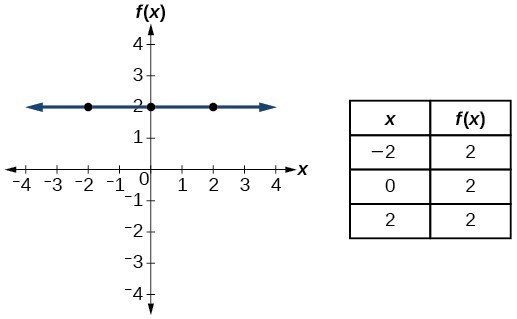 |
| Identity/Linear | [latex]f\left(x\right)=x[/latex] |
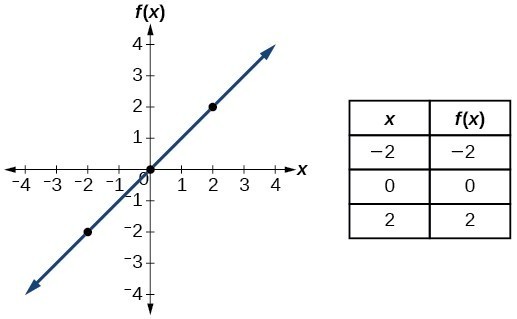 |
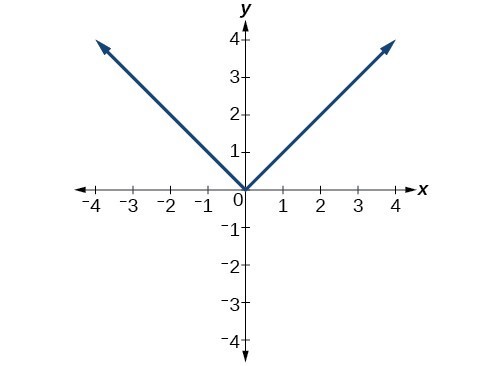
| Absolute value | [latex]f\left(x\right)=|x|[/latex] |
 |
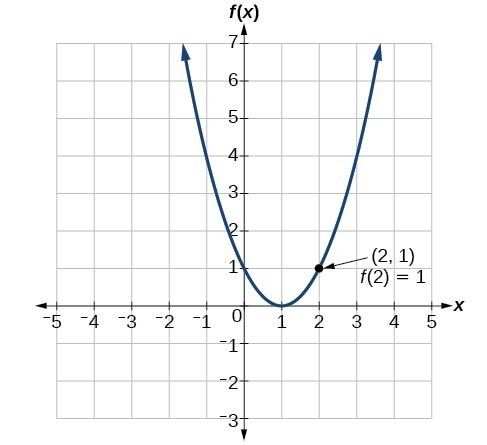
| Quadratic | [latex]f\left(x\right)={x}^{2}[/latex] |
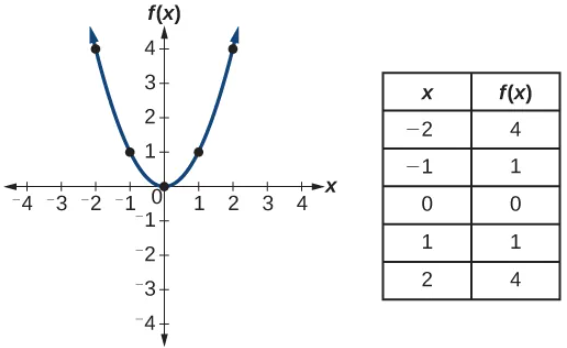 |
| Cubic | [latex]f\left(x\right)={x}^{3}[/latex] |
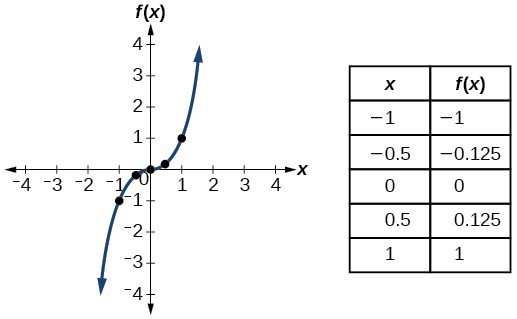 |
| Reciprocal | [latex]f\left(x\right)=\frac{1}{x}[/latex] |
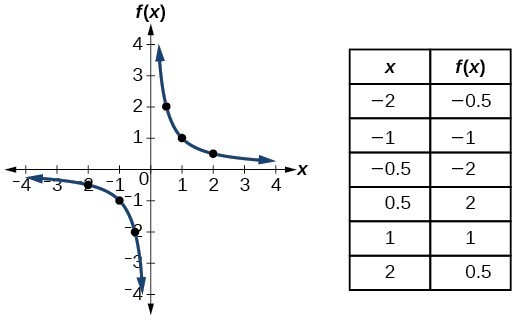 |
| Reciprocal squared | [latex]f\left(x\right)=\frac{1}{{x}^{2}}[/latex] |
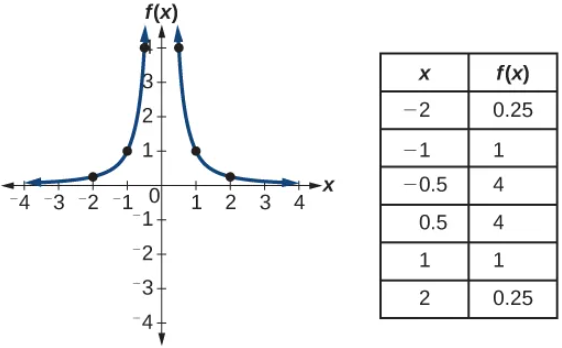 |
| Square root | [latex]f\left(x\right)=\sqrt{x}[/latex] |
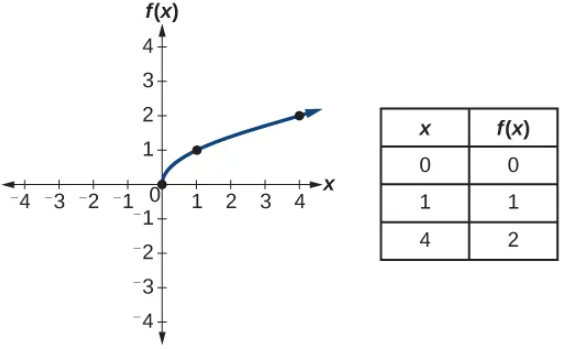 |
| Cube root | [latex]f\left(x\right)=\sqrt[3]{x}[/latex] |
 |