Describing Horizontal and Vertical Lines
There are two special cases of lines on a graph—horizontal and vertical lines.
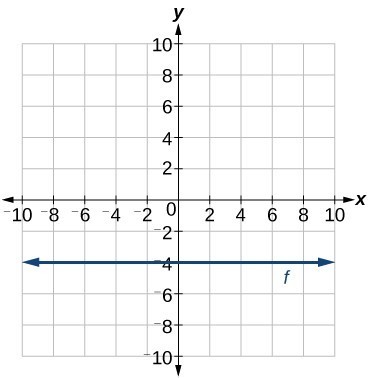
A horizontal line is a line defined by an equation of the form [latex]f\left(x\right)=b[/latex] where [latex]b[/latex] is a constant. A horizontal line indicates a constant output or [latex]y[/latex]-value.
[latex]\\[/latex]
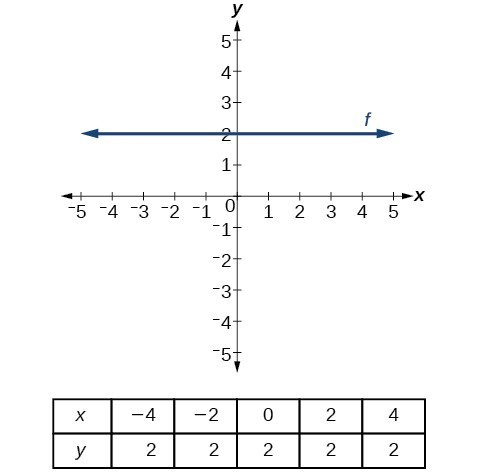
In other words, the value of the function is a constant. This graph represents the function [latex]f(x)=2[/latex].
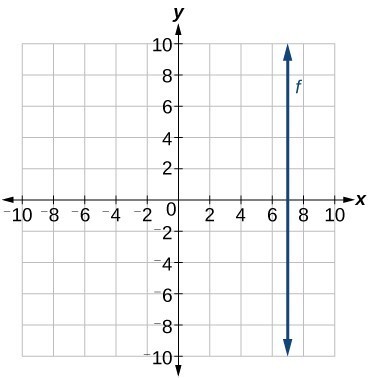
A vertical line is a line defined by an equation of the form [latex]x=a[/latex] where [latex]a[/latex] is a constant. A vertical line indicates a constant input or [latex]x[/latex]-value.
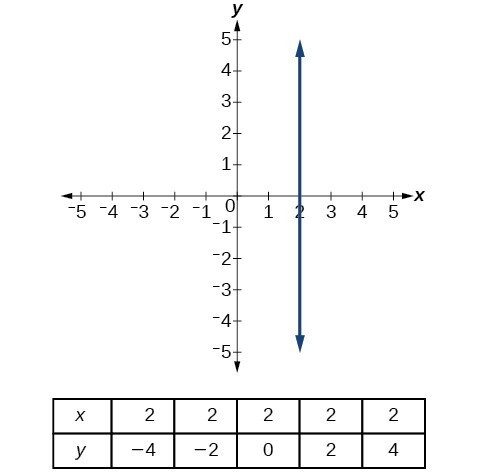
We can see that the input value for every point on the line is [latex]2[/latex], but the output value varies. Because this input value is mapped to more than one output value, a vertical line does not represent a function. Notice that between any two points, the change in the input values is zero. In the slope formula, the denominator will be zero, so the slope of a vertical line is undefined.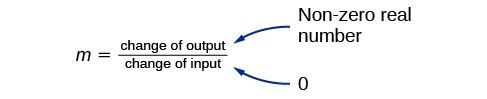 Notice that a vertical line has an [latex]x[/latex]-intercept but no [latex]y[/latex]–intercept unless it’s the line [latex]x= 0[/latex]. This graph represents the line [latex]x= 2[/latex].
horizontal and vertical lines
Lines can be horizontal or vertical.
- A horizontal line is a line defined by an equation of the form [latex]f\left(x\right)=b[/latex] where [latex]b[/latex] is a constant.
- A vertical line is a line defined by an equation of the form [latex]x=a[/latex] where [latex]a[/latex] is a constant.