Sometimes, we come across a function that requires more than one formula in order to obtain the given output. For example, in the toolkit functions, we introduced the absolute value function [latex]f\left(x\right)=|x|[/latex]. With a domain of all real numbers and a range of values greater than or equal to 0, absolute value can be defined as the magnitude, or modulus, of a real number value regardless of sign. It is the distance from 0 on the number line. All of these definitions require the output to be greater than or equal to 0.
If we input 0, or a positive value, the output is the same as the input.
[latex]f\left(x\right)=x\text{ if }x\ge 0[/latex]
If we input a negative value, the output is the opposite of the input.
[latex]f\left(x\right)=-x\text{ if }x<0[/latex]
Because this requires two different processes or pieces, the absolute value function is an example of a piecewise function. A piecewise function is a function in which more than one formula is used to define the output over different pieces of the domain.
piecewise function
A piecewise function is a function in which more than one formula is used to define the output. Each formula has its own domain, and the domain of the function is the union of all these smaller domains. We notate this idea like this:
[latex]f\left(x\right)=\begin{cases}\text{formula 1 if x is in domain 1}\\ \text{formula 2 if x is in domain 2}\\ \text{formula 3 if x is in domain 3}\end{cases}[/latex]
In piecewise notation, the absolute value function is
[latex]|x|=\begin{cases}\begin{align}x&\text{ if }x\ge 0\\ -x&\text{ if }x<0\end{align}\end{cases}[/latex]
We use piecewise functions to describe situations in which a rule or relationship changes as the input value crosses certain “boundaries.”
For example, we often encounter situations in business for which the cost per piece of a certain item is discounted once the number ordered exceeds a certain value. Tax brackets are another real-world example of piecewise functions.
For example, consider a simple tax system in which incomes up to [latex]$10,000[/latex] are taxed at [latex]10\%[/latex], and any additional income is taxed at [latex]20\%[/latex]. The tax on a total income, [latex]S[/latex] , would be [latex]0.1S[/latex] if [latex]{S}\le$10,000[/latex] and [latex]1000 + 0.2 (S - $10,000)[/latex] , if [latex]S> $10,000[/latex] .
How To: Given a piecewise function, write the formula and identify the domain for each interval.
Identify the intervals for which different rules apply.
Determine formulas that describe how to calculate an output from an input in each interval.
Use braces and if-statements to write the function.
The curly brace that appears in a piecewise formula doesn’t denote a set, since there is no matching brace on the other side of the statement. Instead, it indicates that the right hand side of the function formula is made of different pieces, each depending on the input.
You can read it as a list of if-then statements for the function value.
Piecewise functions are challenging to understand. Give yourself time to work with them repeatedly on paper, evaluating and graphing different functions. It’s natural to need to work many problems before you feel comfortable with them.
A museum charges [latex]$5[/latex] per person for a guided tour with a group of [latex]1[/latex] to [latex]9[/latex] people or a fixed [latex]$50[/latex] fee for a group of [latex]10[/latex] or more people. Write a function relating the number of people, [latex]n[/latex], to the cost, [latex]C[/latex].
Two different formulas will be needed. For [latex]n[/latex]-values under [latex]10[/latex], [latex]C=5n[/latex]. For values of [latex]n[/latex] that are [latex]10[/latex] or greater, [latex]C=50[/latex].
The graph is a diagonal line from [latex]n=0[/latex] to [latex]n=10[/latex] and a constant after that. In this example, the two formulas agree at the meeting point where [latex]n=10[/latex], but not all piecewise functions have this property.
Graph of C(n)
A cell phone company uses the function below to determine the cost, [latex]C[/latex], in dollars for [latex]g[/latex] gigabytes of data transfer.
[latex]C\left(g\right)=\begin{cases}\begin{align}{25} \hspace{2mm}&\text{ if }\hspace{2mm}{ 0 }<{ g }<{ 2 }\\ { 25+10 }\left(g - 2\right) \hspace{2mm}&\text{ if }\hspace{2mm}{ g}\ge{ 2 }\end{align}\end{cases}[/latex]
Find the cost of using [latex]1.5[/latex] gigabytes of data and the cost of using [latex]4[/latex] gigabytes of data.
To find the cost of using [latex]1.5[/latex] gigabytes of data, [latex]C(1.5)[/latex], we first look to see which part of the domain our input falls in. Because [latex]1.5[/latex] is less than [latex]2[/latex], we use the first formula.
[latex]C(1.5) = $25[/latex]
To find the cost of using [latex]4[/latex] gigabytes of data, [latex]C(4)[/latex], we see that our input of [latex]4[/latex] is greater than [latex]2[/latex], so we use the second formula.
[latex]C(4)=25 + 10( 4-2) =$45[/latex]
Analysis of the Solution
We can see where the function changes from a constant to a shifted and stretched identity at [latex]g=2[/latex]. We plot the graphs for the different formulas on a common set of axes, making sure each formula is applied on its proper domain.
Graph of C(g)
How To: Given a piecewise function, sketch a graph.
Indicate on the [latex]x[/latex]-axis the boundaries defined by the intervals on each piece of the domain.
For each piece of the domain, graph on that interval using the corresponding equation pertaining to that piece. Do not graph two functions over one interval because it would violate the criteria of a function.
Sketch a graph of the function.
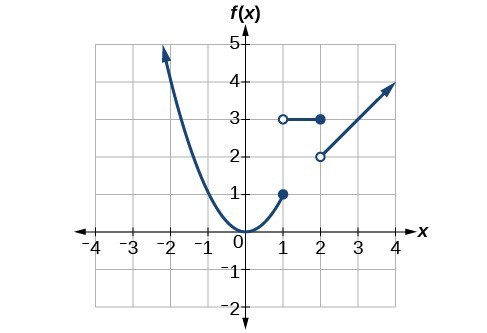
[latex]f\left(x\right)=\begin{cases}\begin{align}{ x }^{2} \hspace{2mm}&\text{ if }\hspace{2mm}{ x }\le{ 1 }\\ { 3 } \hspace{2mm}&\text{ if }\hspace{2mm} { 1 }<{ x }\le 2\\ { x } \hspace{2mm}&\text{ if }\hspace{2mm}{ x }>{ 2 }\end{align}\end{cases}[/latex]
Each of the component functions is from our library of toolkit functions, so we know their shapes. We can imagine graphing each function and then limiting the graph to the indicated domain. At the endpoints of the domain, we draw open circles to indicate where the endpoint is not included because of a less-than or greater-than inequality; we draw a closed circle where the endpoint is included because of a less-than-or-equal-to or greater-than-or-equal-to inequality.
Below are the three components of the piecewise function graphed on separate coordinate systems.
(a) [latex]f\left(x\right)={x}^{2}\text{ if }x\le 1[/latex]; (b) [latex]f\left(x\right)=3\text{ if 1< }x\le 2[/latex]; (c) [latex]f\left(x\right)=x\text{ if }x>2[/latex]
Graph of each part of the piece-wise function f(x)
Now that we have sketched each piece individually, we combine them in the same coordinate plane.
Graph of the entire function
Analysis of the Solution
Note that the graph does pass the vertical line test even at [latex]x=1[/latex] and [latex]x=2[/latex] because the points [latex]\left(1,3\right)[/latex] and [latex]\left(2,2\right)[/latex] are not part of the graph of the function, though [latex]\left(1,1\right)[/latex] and [latex]\left(2,3\right)[/latex] are.
You can use an online graphing calculator to graph piecewise defined functions. Watch this tutorial video to learn how within Desmos. Other online graphing tools will be slightly different.
Graph the following piecewise function with an online graphing calculator.
[latex]f\left(x\right)=\begin{cases}\begin{align}{ x}^{3} \hspace{2mm}&\text{ if }\hspace{2mm}{ x }<{-1 }\\ { -2 } \hspace{2mm}&\text{ if } \hspace{2mm}{ -1 }<{ x }<{ 4 }\\ \sqrt{x} \hspace{2mm}&\text{ if }\hspace{2mm}{ x }>{ 4 }\end{align}\end{cases}[/latex]