Using Intercepts to Plot Lines in the Coordinate Plane
The intercepts of a graph are points where the graph crosses the axes. The [latex]x[/latex]–intercept is the point where the graph crosses the x-axis. At this point, the y-coordinate is zero. The [latex]y[/latex]–intercept is the point where the graph crosses the [latex]y[/latex]–axis. At this point, the [latex]x[/latex]–coordinate is zero.
intercepts
The intercepts of a graph are points at which the graph crosses the axes.
- The [latex]x[/latex]-intercept is the point at which the graph crosses the [latex]x[/latex]-axis. At this point, the [latex]y[/latex]-coordinate is zero.
- The [latex]y[/latex]-intercept is the point at which the graph crosses the [latex]y[/latex]-axis. At this point, the [latex]x[/latex]-coordinate is zero.
- Find the [latex]x[/latex]-intercept by setting [latex]y=0[/latex] and solving for [latex]x[/latex].
- Find the [latex]y[/latex]–intercept by setting [latex]x=0[/latex] and solving for [latex]y[/latex].
- To find the [latex]x[/latex]–intercept, set [latex]y=0[/latex].
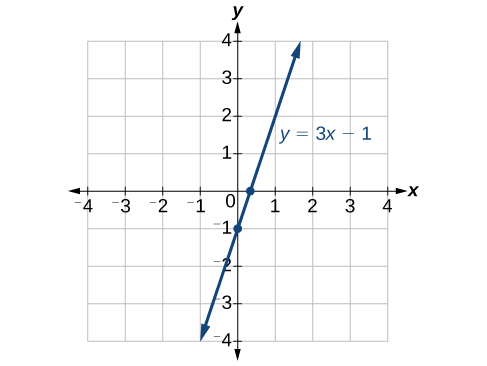
[latex]\begin{array}{llllll}y=3x - 1\hfill & \hfill \\ 0=3x - 1\hfill & \hfill \\ 1=3x\hfill & \hfill \\ \frac{1}{3}=x\hfill & \hfill \\ \left(\frac{1}{3},0\right)\hfill & x\text{-intercept}\hfill \end{array}[/latex]
- To find the [latex]y[/latex]–intercept, set [latex]x=0[/latex].
[latex]\begin{array}{lllll}y=3x - 1\hfill & \hfill \\ y=3\left(0\right)-1\hfill & \hfill \\ y=-1\hfill & \hfill \\ \left(0,-1\right)\hfill & y\text{-intercept}\hfill \end{array}[/latex]

https://www.geogebra.org/graphing
https://www.desmos.com/calculator
https://www.symbolab.com/graphing-calculator
Try it now
These graphing utilities have features that allow you to turn a constant (number) into a variable. Follow these steps to learn how:
- Graph the line [latex]y=-\frac{2}{3}x-\frac{4}{3}[/latex].
- On the next line enter [latex]y=-a x-\frac{4}{3}[/latex]. You will see a button pop up that says “add slider: a”, click on the button. You will see the next line populated with the variable a and the interval on which a can take values.
- What part of a line does the variable a represent? The slope or the y-intercept?