- Draw the graph of linear equations by plotting points.
- Determine the slope based on the steepness and direction of a line.
- Find the x-intercept and y-intercept of linear equations and graphs.
- Use formulas to calculate the distances and midpoints between points.
Plotting Points
The Main Idea
- Origin and Axes:
- Two perpendicular lines: [latex]x[/latex]-axis (horizontal) and y-axis (vertical)
- Intersection point of axes: origin, denoted as [latex]0,0[/latex]
- Quadrants:
- Plane divided into four quadrants, numbered counterclockwise
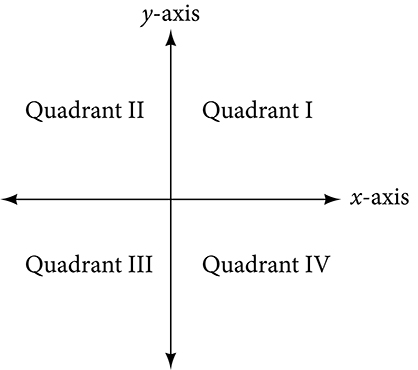
x,y plane with quadrants labeled
- Plane divided into four quadrants, numbered counterclockwise
- Ordered Pairs:
- Points represented as[latex](x,y)[/latex]
- [latex]x[/latex]-coordinate: horizontal displacement from origin
- [latex]y[/latex]-coordinate: vertical displacement from origin
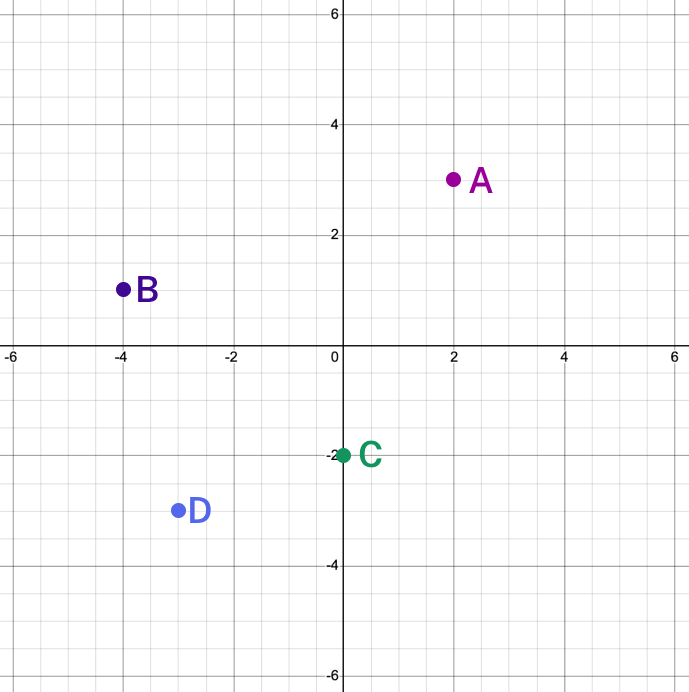
- Plotting Points:
- Move horizontally by x units, then vertically by y units
- Positive [latex]x[/latex]: move right; Negative [latex]x[/latex]: move left
- Positive [latex]y[/latex]: move up; Negative [latex]y[/latex]: move down
- Special Cases:
- Points on x-axis: y-coordinate is zero, latex[/latex]
- Points on y-axis: x-coordinate is zero
[latex]A(2,3), B(-4,1), C(0,-2), D(-3,-3)[/latex]
You can view the transcript for “Ex: Plotting Points on the Coordinate Plane” here (opens in new window).
Graphing Equations by Plotting Points
The Main Idea
- Equations in Two Variables:
- Contain both x and y variables
- Represented as graphs in a two-dimensional plane
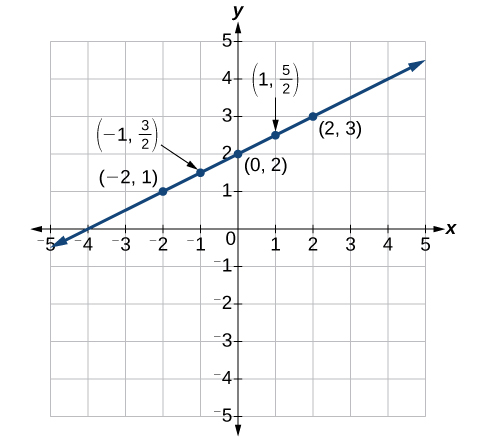
- Plotting Points:
- Create a table with x, y, and (x,y) columns
- Choose strategic x-values for easy calculation
- Calculate corresponding y-values
- Plot the resulting ordered pairs (x,y)
- Connecting Points:
- If points form a straight line, connect them
- Not all equations result in straight lines
You can view the transcript for “Graphing Equations by Plotting Points – Example 1” here (opens in new window).
Using Intercepts to Plot Lines in the Coordinate Plane
The Main Idea
- Intercepts Definition:
- Points where a graph crosses the axes
- x-intercept: crosses x-axis (y = 0)
- y-intercept: crosses y-axis (x = 0)
- Finding x-intercept:
- Set y = 0 in the equation
- Solve for x
- Express as ordered pair (x, 0)
- Finding y-intercept:
- Set x = 0 in the equation
- Solve for y
- Express as ordered pair (0, y)
- Graphing Process:
- Calculate both intercepts
- Plot the intercept points
- Draw a line through these points
- Efficiency:
- Only two points needed to define a line
- Quicker than plotting multiple points

You can view the transcript for “Graphing using x- and y-intercepts | Graphing lines and slope | Algebra Basics | Khan Academy” here (opens in new window).
Slope of a Linear Equation
The Main Idea
- Definition of Slope:
- Ratio of vertical change (rise) to horizontal change (run)
- Measures steepness and direction of a line
- Formula: [latex]m = \frac{\text{rise}}{\text{run}} = \frac{y_2 - y_1}{x_2 - x_1}[/latex]
- Interpretation of Slope:
- Positive slope: Line rises from left to right
- Negative slope: Line falls from left to right
- Zero slope: Horizontal line
- Undefined slope: Vertical line
- Slope in Different Contexts:
- In economics: Rate of change (e.g., marginal cost)
- In physics: Velocity in distance-time graphs
- In statistics: Correlation between variables
- Calculating Slope:
- Choose any two points on the line
- Apply the slope formula
- Simplify the fraction if possible
You can view the transcript for “How to find the slope between two points” here (opens in new window).
Distance Formula
The Main Idea
- Origin and Concept:
- Derived from the Pythagorean Theorem
- Calculates the straight-line distance between two points
- Formula: [latex]d = \sqrt{(x_2 - x_1)^2 + (y_2 - y_1)^2}[/latex] Where [latex](x_1, y_1)[/latex] and [latex](x_2, y_2)[/latex] are the coordinates of two points
- Geometric Interpretation:
- Forms a right triangle with the two points and their projections
- Hypotenuse of this triangle is the distance between points
- Applications:
- Navigation and GPS systems
- Computer graphics and game development
- Spatial analysis in geography
You can view the transcript for “Example: Determine the Distance Between Two Points” here (opens in new window).
Midpoint Formula
The Main Idea
- Definition:
- The midpoint is the point that divides a line segment into two equal parts
- It’s located exactly halfway between the endpoints
- Formula: For endpoints [latex](x_1, y_1)[/latex] and [latex](x_2, y_2)[/latex], the midpoint [latex]M[/latex] is: [latex]M = \left(\frac{x_1 + x_2}{2}, \frac{y_1 + y_2}{2}\right)[/latex]
- Geometric Interpretation:
- The x-coordinate of the midpoint is the average of the x-coordinates of the endpoints
- The y-coordinate of the midpoint is the average of the y-coordinates of the endpoints
- Applications:
- Finding centers of objects in computer graphics
- Calculating average positions in physics
- Determining midpoints of ranges in statistics
You can view the transcript for “Given two Endpoints Find the Midpoint of a Segment” here (opens in new window).