- Learn to plot points and draw lines on a graph using a set of coordinates.
- Find the x-intercept and y-intercept of graphs.
- Determine the slope based on the steepness and direction of a line.
- Use formulas to calculate the distances and midpoints between points.
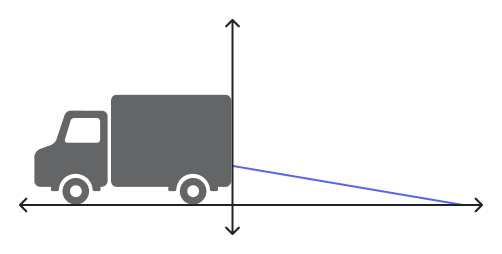
Loading Dock Safety: Analyzing Ramp Slopes
The safety specifications for a semi-truck loading ramp can be modeled by the linear equation [latex]y = (-\frac{1}{4})x + 4.25[/latex], where [latex]x[/latex] represents the horizontal distance in feet from the back of the truck, and [latex]y[/latex] represents the height of the ramp in feet above the ground. For practical purposes, we’ll focus on the portion of the graph in Quadrant I, where both [latex]x[/latex] and [latex]y[/latex] are positive.