Transformations of Exponential Graphs
Transformations of exponential graphs behave similarly to those of other functions. Just as with other parent functions, we can apply the four types of transformations—shifts, reflections, stretches, and compressions—to the parent function [latex]f(x)={b}^{x}[/latex] without loss of shape.
Graphing a Vertical Shift
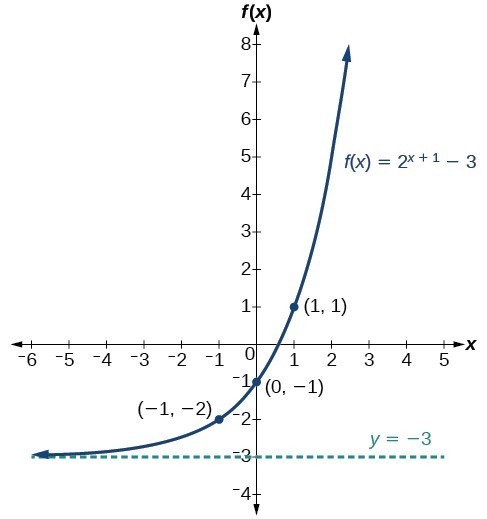
The first transformation occurs when we add a constant [latex]d[/latex] to the parent function [latex]f\left(x\right)={b}^{x}[/latex] giving us a vertical shift [latex]d[/latex] units in the same direction as the sign.
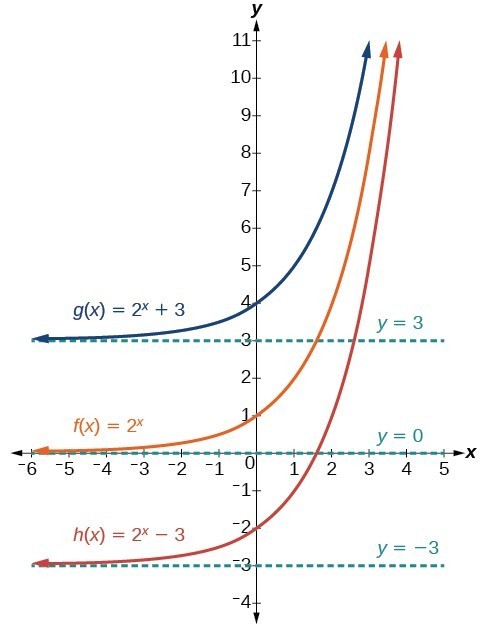
Observe the results of shifting [latex]f\left(x\right)={2}^{x}[/latex] vertically:
- The domain [latex]\left(-\infty ,\infty \right)[/latex] remains unchanged.
- When the function is shifted up [latex]3[/latex] units giving [latex]g\left(x\right)={2}^{x}+3[/latex]:
- The [latex]y[/latex]–intercept shifts up [latex]3[/latex] units to [latex]\left(0,4\right)[/latex].
- The asymptote shifts up [latex]3[/latex] units to [latex]y=3[/latex].
- The range becomes [latex]\left(3,\infty \right)[/latex].
- When the function is shifted down [latex]3[/latex] units giving [latex]h\left(x\right)={2}^{x}-3[/latex]:
- The [latex]y[/latex]–intercept shifts down [latex]3[/latex] units to [latex]\left(0,-2\right)[/latex].
- The asymptote also shifts down [latex]3[/latex] units to [latex]y=-3[/latex].
- The range becomes [latex]\left(-3,\infty \right)[/latex].
- Use an online graphing calculator to plot [latex]f(x) = 2^x+a[/latex]
- Adjust the value of [latex]a[/latex] until the graph has been shifted [latex]4[/latex] units up.
- Add a line that represents the horizontal asymptote for this function. What is the equation for this function? What is the new [latex]y[/latex]-intercept? What is its domain and range?
- Now create a graph of the function [latex]f(x) = 2^x[/latex] that has been shifted down [latex]2[/latex] units. Add a line that represents the horizontal asymptote. What is the equation for this function? What is the new [latex]y[/latex]-intercept? What is its domain and range?
Graphing a Horizontal Shift
The next transformation occurs when we add a constant [latex]c[/latex] to the input of the parent function [latex]f\left(x\right)={b}^{x}[/latex] giving us a horizontal shift [latex]c[/latex] units in the opposite direction of the sign.
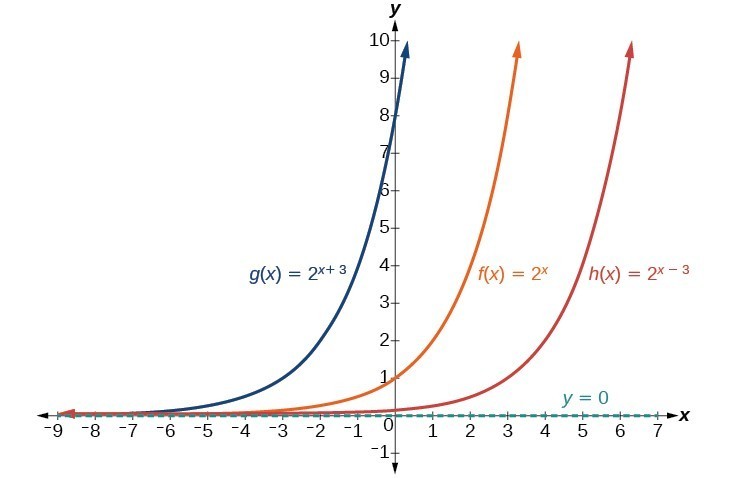
Observe the results of shifting [latex]f\left(x\right)={2}^{x}[/latex] horizontally:
- The domain, [latex]\left(-\infty ,\infty \right)[/latex], remains unchanged.
- The asymptote, [latex]y=0[/latex], remains unchanged.
- The [latex]y[/latex]–intercept shifts such that:
- When the function is shifted left [latex]3[/latex] units to [latex]g\left(x\right)={2}^{x+3}[/latex], the [latex]y[/latex]-intercept becomes [latex]\left(0,8\right)[/latex]. This is because [latex]{2}^{x+3}=\left({2}^{3}\right){2}^{x}=\left(8\right){2}^{x}[/latex], so the initial value of the function is [latex]8[/latex].
- When the function is shifted right [latex]3[/latex] units to [latex]h\left(x\right)={2}^{x - 3}[/latex], the [latex]y[/latex]-intercept becomes [latex]\left(0,\frac{1}{8}\right)[/latex]. Again, see that [latex]{2}^{x-3}=\left({2}^{-3}\right){2}^{x}=\left(\frac{1}{8}\right){2}^{x}[/latex], so the initial value of the function is [latex]\frac{1}{8}[/latex].
- Using an online graphing calculator, plot [latex]f(x) = 2^{(x+a)}[/latex]
- Adjust the value of [latex]a[/latex] until the graph is shifted [latex]4[/latex] units to the right. What is the equation for this function? What is the new [latex]y[/latex]-intercept? What are its domain and range?
- Now adjust the value of [latex]a[/latex] until the graph has been shifted [latex]3[/latex] units to the left. What is the equation for this function? What is the new [latex]y[/latex]-intercept? What are its domain and range?
shifts of the parent function [latex]f\left(x\right)={b}^{x}[/latex]
For any constants [latex]c[/latex] and [latex]d[/latex], the function [latex]f\left(x\right)={b}^{x+c}+d[/latex] shifts the parent function [latex]f\left(x\right)={b}^{x}[/latex]
- shifts the parent function [latex]f\left(x\right)={b}^{x}[/latex] vertically [latex]d[/latex] units, in the same direction as the sign of [latex]d[/latex].
- shifts the parent function [latex]f\left(x\right)={b}^{x}[/latex] horizontally [latex]c[/latex] units, in the opposite direction as the sign of [latex]c[/latex].
- has a [latex]y[/latex]-intercept of [latex]\left(0,{b}^{c}+d\right)[/latex].
- has a horizontal asymptote of [latex]y = d[/latex].
- has a range of [latex]\left(d,\infty \right)[/latex].
- has a domain of [latex]\left(-\infty ,\infty \right)[/latex] which remains unchanged.
- Draw the horizontal asymptote [latex]y = d[/latex].
- Shift the graph of [latex]f\left(x\right)={b}^{x}[/latex] left [latex]c[/latex] units if [latex]c[/latex] is positive and right [latex]c[/latex] units if [latex]c[/latex] is negative.
- Shift the graph of [latex]f\left(x\right)={b}^{x}[/latex] up [latex]d[/latex] units if [latex]d[/latex] is positive and down [latex]d[/latex] units if [latex]d[/latex] is negative.
- State the domain, [latex]\left(-\infty ,\infty \right)[/latex], the range, [latex]\left(d,\infty \right)[/latex], and the horizontal asymptote [latex]y=d[/latex].