Finding Equations of Exponential Functions
In the previous examples, we were given an exponential function which we then evaluated for a given input. Sometimes we are given information about an exponential function without knowing the function explicitly. We must use the information to first write the form of the function, determine the constants [latex]a[/latex] and [latex]b[/latex], and evaluate the function.
- If one of the data points has the form [latex]\left(0,a\right)[/latex], then [latex]a[/latex] is the initial value. Using [latex]a[/latex], substitute the second point into the equation [latex]f\left(x\right)=a{b}^{x}[/latex], and solve for [latex]b[/latex].
- If neither of the data points have the form [latex]\left(0,a\right)[/latex], substitute both points into two equations with the form [latex]f\left(x\right)=a{b}^{x}[/latex]. Solve the resulting system of two equations to find [latex]a[/latex] and [latex]b[/latex].
- Using the [latex]a[/latex] and [latex]b[/latex] found in the steps above, write the exponential function in the form [latex]f\left(x\right)=a{b}^{x}[/latex].
[latex]\\[/latex]
Write an algebraic function [latex]N(t)[/latex] representing the population [latex]N[/latex] of deer over time [latex]t[/latex].


Yes, provided the two points are either both above the [latex]x[/latex]-axis or both below the [latex]x[/latex]-axis and have different [latex]x[/latex]-coordinates. But keep in mind that we also need to know that the graph is, in fact, an exponential function. Not every graph that looks exponential really is exponential. We need to know the graph is based on a model that shows the same percent growth with each unit increase in [latex]x[/latex], which in many real world cases involves time.
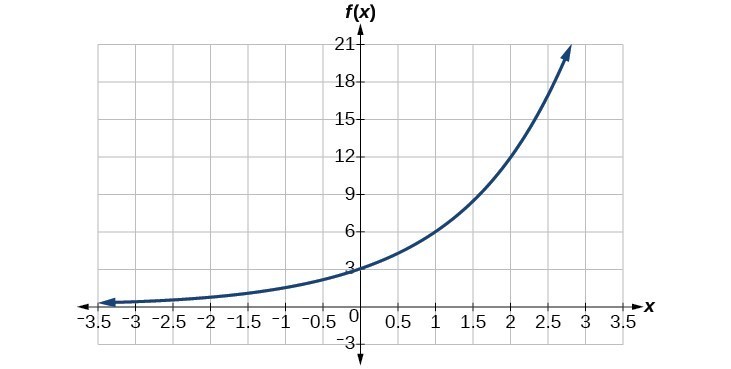
- First, identify two points on the graph. Choose the [latex]y[/latex]-intercept as one of the two points whenever possible. Try to choose points that are as far apart as possible to reduce round-off error.
- If one of the data points is the y-intercept [latex]\left(0,a\right)[/latex] , then [latex]a[/latex] is the initial value. Using [latex]a[/latex], substitute the second point into the equation [latex]f\left(x\right)=a{b}^{x}[/latex] and solve for [latex]b[/latex].
- If neither of the data points have the form [latex]\left(0,a\right)[/latex], substitute both points into two equations with the form [latex]f\left(x\right)=a{b}^{x}[/latex]. Solve the resulting system of two equations to find [latex]a[/latex] and [latex]b[/latex].
- Write the exponential function, [latex]f\left(x\right)=a{b}^{x}[/latex].