Evaluating Exponential Functions with Base [latex]e[/latex]
As we saw earlier, the amount earned on an account increases as the compounding frequency increases. The table below shows that the increase from annual to semi-annual compounding is larger than the increase from monthly to daily compounding. This might lead us to ask whether this pattern will continue.
Examine the value of [latex]$1[/latex] invested at [latex]100 \%[/latex] interest for [latex]1[/latex] year compounded at various frequencies.
| Frequency | [latex]A\left(t\right)={\left(1+\frac{1}{n}\right)}^{n}[/latex] | Value |
|---|---|---|
| Annually | [latex]{\left(1+\frac{1}{1}\right)}^{1}[/latex] | [latex]$2[/latex] |
| Semiannually | [latex]{\left(1+\frac{1}{2}\right)}^{2}[/latex] | [latex]$2.25[/latex] |
| Quarterly | [latex]{\left(1+\frac{1}{4}\right)}^{4}[/latex] | [latex]$2.441406[/latex] |
| Monthly | [latex]{\left(1+\frac{1}{12}\right)}^{12}[/latex] | [latex]$2.613035[/latex] |
| Daily | [latex]{\left(1+\frac{1}{365}\right)}^{365}[/latex] | [latex]$2.714567[/latex] |
| Hourly | [latex]{\left(1+\frac{1}{\text{8766}}\right)}^{\text{8766}}[/latex] | [latex]$2.718127[/latex] |
| Once per minute | [latex]{\left(1+\frac{1}{\text{525960}}\right)}^{\text{525960}}[/latex] | [latex] $2.718279[/latex] |
| Once per second | [latex]{\left(1+\frac{1}{31557600}\right)}^{31557600}[/latex] | [latex]$2.718282[/latex] |
These values appear to be approaching a limit as [latex]n[/latex] increases without bound. In fact, as [latex]n[/latex] gets larger and larger, the expression [latex]{\left(1+\frac{1}{n}\right)}^{n}[/latex] approaches a number used so frequently in mathematics that it has its own name: the letter [latex]e[/latex]. This value is an irrational number, which means that its decimal expansion goes on forever without repeating.
the number [latex]e[/latex]
The letter [latex]e[/latex] represents the irrational number
[latex]{\left(1+\frac{1}{n}\right)}^{n},\text{as }n\text{ increases without bound}[/latex]
The letter [latex]e[/latex] is used as a base for many real-world exponential models. To work with base [latex]e[/latex], we use the approximation, [latex]e\approx 2.718282[/latex].
The constant was named by the Swiss mathematician Leonhard Euler (1707–1783) who first investigated and discovered many of its properties.
To graph the function [latex]f(x) = e^x[/latex], let’s identify and plot key points on the graph.
| [latex]x[/latex] | [latex]f(x) = e^x[/latex] |
| [latex]-1[/latex] | [latex]f(-1) = e^{-1} \approx 0.37[/latex] |
| [latex]0[/latex] | [latex]f(-1) = e^{0} \approx 1[/latex] |
| [latex]1[/latex] | [latex]f(-1) = e^{1} \approx 2.72[/latex] |
| [latex]2[/latex] | [latex]f(-1) = e^{2} \approx 7.39[/latex] |
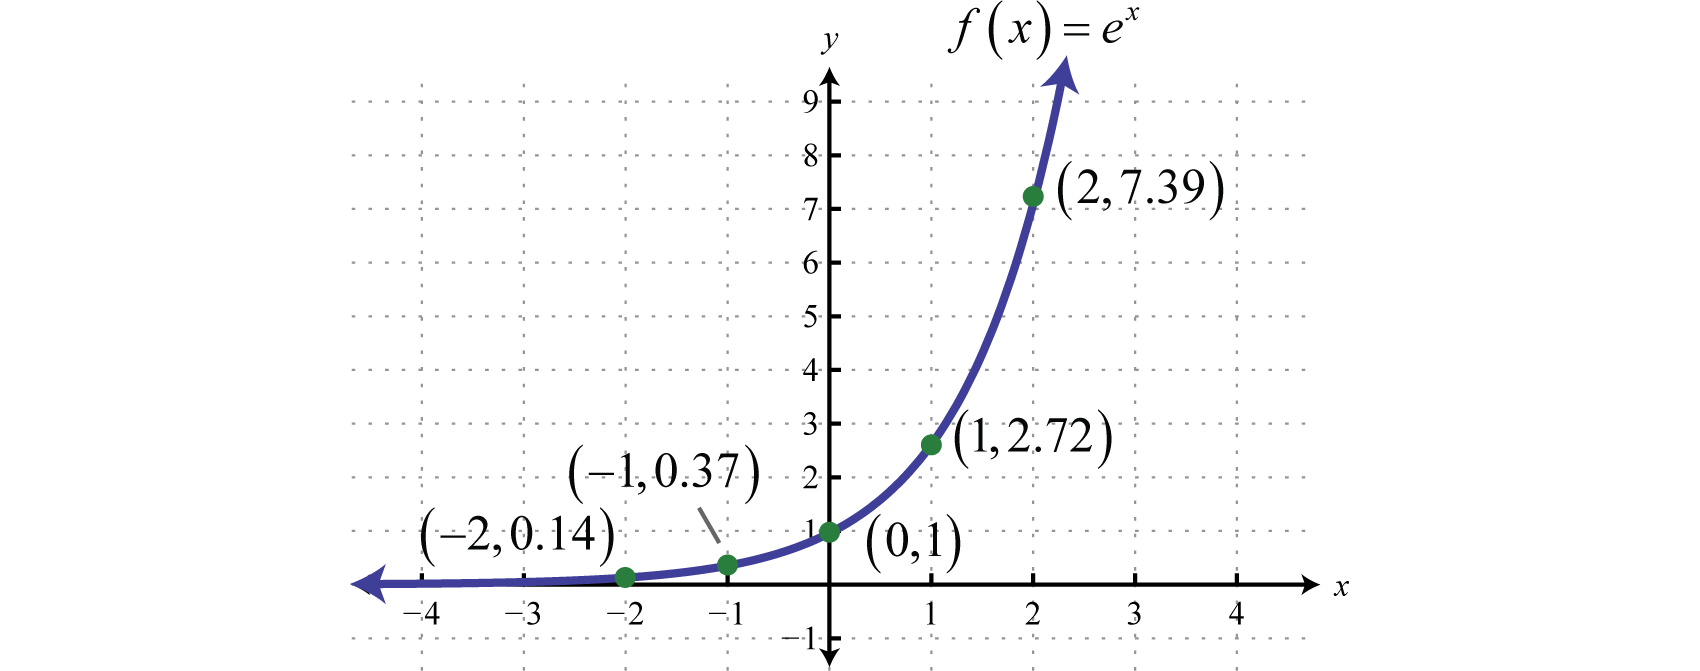
Characteristics:
[latex]\begin{align*} \text{Function:} & \quad f(x) = e^x \\ \text{Domain:} & \quad (-\infty, \infty) \\ \text{Range:} & \quad (0, \infty) \\ \text{Y-intercept:} & \quad (0, 1) \\ \text{Horizontal Asymptote:} & \quad y = 0 \\ \text{Behavior as } x \rightarrow \infty: & \quad f(x) \rightarrow \infty \\ \text{Behavior as } x \rightarrow -\infty: & \quad f(x) \rightarrow 0 \end{align*}[/latex]