- Learn to plot points and draw lines on a graph using a set of coordinates.
- Find the x-intercept and y-intercept of graphs.
- Determine the slope based on the steepness and direction of a line.
- Use formulas to calculate the distances and midpoints between points.
An old story describes how seventeenth-century philosopher/mathematician René Descartes invented the system that has become the foundation of algebra while sick in bed. According to the story, Descartes was staring at a fly crawling on the ceiling when he realized that he could describe the fly’s location in relation to the perpendicular lines formed by the adjacent walls of his room. He viewed the perpendicular lines as horizontal and vertical axes. Further, by dividing each axis into equal unit lengths, Descartes saw that it was possible to locate any object in a two-dimensional plane using just two numbers—the displacement from the horizontal axis and the displacement from the vertical axis.
While there is evidence that ideas similar to Descartes’ grid system existed centuries earlier, it was Descartes who introduced the components that comprise the Cartesian coordinate system, a grid system having perpendicular axes. Descartes named the horizontal axis the x-axis and the vertical axis the y-axis.
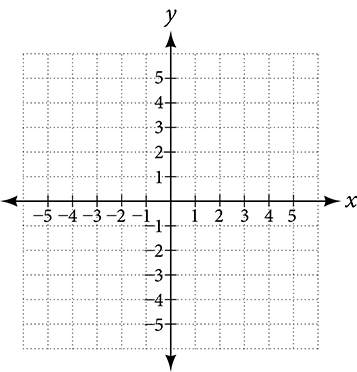
The Cartesian coordinate system, also called the rectangular coordinate system, is based on a two-dimensional plane consisting of the x-axis and the y-axis.
Perpendicular to each other, the axes divide the plane into four sections. Each section is called a quadrant; the quadrants are numbered counterclockwise as shown in the figure below.
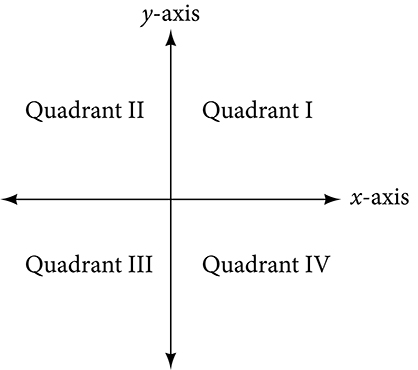
The center of the plane is the point at which the two axes cross. It is known as the origin or point [latex]\left(0,0\right)[/latex]. From the origin, each axis is further divided into equal units: increasing, positive numbers to the right on the x-axis and up the y-axis; decreasing, negative numbers to the left on the x-axis and down the y-axis. The axes extend to positive and negative infinity as shown by the arrowheads in the figure below.
Cartesian coordinate system
A two-dimensional plane where the
- [latex]x[/latex]-axis is the horizontal axis
- [latex]y[/latex]-axis is the vertical axis
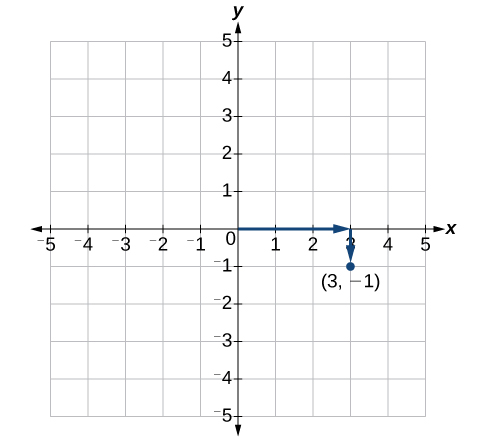
A point in the plane is defined as an ordered pair, [latex](x,y)[/latex], such that [latex]x[/latex] is determined by its horizontal distance from the origin and [latex]y[/latex] is determined by its vertical distance from the origin.
Plotting Points
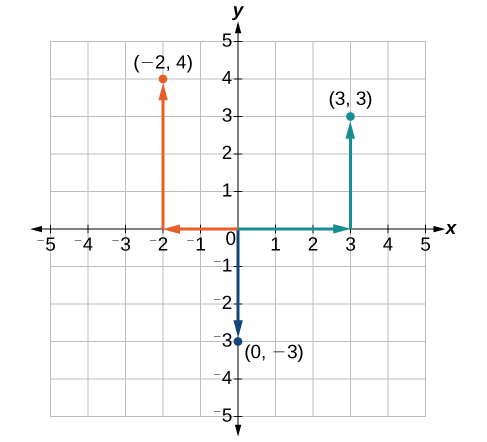
Each point in the plane is identified by its x-coordinate, or horizontal displacement from the origin, and its y-coordinate, or vertical displacement from the origin. Together we write them as an ordered pair indicating the combined distance from the origin in the form [latex]\left(x,y\right)[/latex].