Writing Formulas for Polynomial Functions
Now that we know how to find zeros of polynomial functions, we can use them to write formulas based on graphs. Because a polynomial function written in factored form will have an [latex]x[/latex]-intercept where each factor is equal to zero, we can form a function that will pass through a set of [latex]x[/latex]-intercepts by introducing a corresponding set of factors.
factored form of polynomials
If a polynomial of lowest degree [latex]p[/latex] has zeros at [latex]x={x}_{1},{x}_{2},\dots ,{x}_{n}[/latex], then the polynomial can be written in the factored form:
[latex]f\left(x\right)=a{\left(x-{x}_{1}\right)}^{{p}_{1}}{\left(x-{x}_{2}\right)}^{{p}_{2}}\cdots {\left(x-{x}_{n}\right)}^{{p}_{n}}[/latex]
where
- the powers [latex]{p}_{i}[/latex] on each factor can be determined by the behavior of the graph at the corresponding intercept
- the stretch factor [latex]a[/latex] can be determined given a value of the function other than the [latex]x[/latex]-intercept.
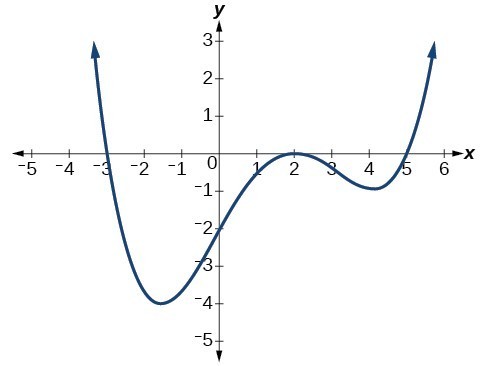
- Identify the [latex]x[/latex]-intercepts of the graph to find the factors of the polynomial.
- Examine the behavior of the graph at the [latex]x[/latex]-intercepts to determine the multiplicity of each factor.
- Find the polynomial of least degree containing all of the factors found in the previous step.
- Use any other point on the graph (the [latex]y[/latex]-intercept may be easiest) to determine the stretch factor.
Local and Global Extrema
With quadratics, we were able to algebraically find the maximum or minimum value of the function by finding the vertex. For general polynomials, finding these turning points is not possible without more advanced techniques from calculus. Even then, finding where extrema occur can still be algebraically challenging. For now, we will estimate the locations of turning points using technology to generate a graph.
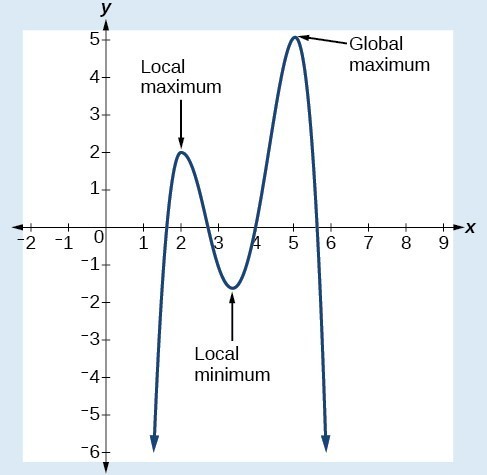
Each turning point represents a local minimum or maximum. Sometimes, a turning point is the highest or lowest point on the entire graph. In these cases, we say that the turning point is a global maximum or a global minimum. These are also referred to as the absolute maximum and absolute minimum values of the function.
local and global extrema
A local maximum or local minimum at [latex]x = a[/latex] (sometimes called the relative maximum or minimum, respectively) is the output at the highest or lowest point on the graph in an open interval around [latex]x = a[/latex].
- If a function has a local maximum at [latex]a[/latex], then [latex]f\left(a\right)\ge f\left(x\right)[/latex] for all [latex]x[/latex] in an open interval around [latex]x = a[/latex].
- If a function has a local minimum at [latex]a[/latex], then [latex]f\left(a\right)\le f\left(x\right)[/latex] for all [latex]x[/latex] in an open interval around [latex]x = a[/latex].
A global maximum or global minimum is the output at the highest or lowest point of the function.
- If a function has a global maximum at [latex]a[/latex], then [latex]f\left(a\right)\ge f\left(x\right)[/latex] for all [latex]x[/latex].
- If a function has a global minimum at [latex]a[/latex], then [latex]f\left(a\right)\le f\left(x\right)[/latex] for all [latex]x[/latex].
No. Only polynomial functions of even degree have a global minimum or maximum. For example, [latex]f\left(x\right)=x[/latex] has neither a global maximum nor a global minimum.
[latex]f\left(x\right)=a{\left(x - \frac{5}{3}\right)}^{3}{\left(x+1\right)}^{2}\left(x - 7\right)[/latex].
Make sure to observe both positive and negative [latex]a[/latex]-values, and large and small [latex]a[/latex]-values.