- Solve equations with squared variables or other exponents using substitution and elimination
- Graph curved inequalities and find where they overlap
Solving a System of Nonlinear Equations Using Substitution
The Main Idea
Common Features
- Solution Types
- No solutions (no intersection)
- One solution (tangent point)
- Two solutions (line crosses through curve)
- Solution Method
- Always start with linear equation
- Solve linear equation for one variable
- Substitute into nonlinear equation
- Solve resulting equation
- Check all solutions in both equations
Line-Parabola Systems
- Form
- Line: [latex]ax + by = c[/latex]
- Parabola: [latex]y = ax^2 + bx + c[/latex]
- Solution Process
- Results in quadratic equation
- Two solutions: Line crosses parabola
- One solution: Line tangent to parabola
- No solutions: Line misses parabola
Line-Circle Systems
- Form
- Line: [latex]ax + by = c[/latex]
- Circle: [latex](x - h)^2 + (y - k)^2 = r^2[/latex]
- Solution Process
- Results in quadratic equation
- Two solutions: Line crosses circle
- One solution: Line tangent to circle
- No solutions: Line outside circle
You can view the transcript for “Solve a NonLinear System of Equations (Linear and Quadratic)” here (opens in new window).
You can view the transcript for “Ex 1: Solve a System of Nonlinear Equations (Substitution)” here (opens in new window).
Solving a System of Nonlinear Equations Using Elimination
The Main Idea
- Method Selection
- Elimination preferred when both equations are nonlinear
- Especially useful when equations have similar terms
- More efficient than substitution for two-by-two systems
- Works well with conic sections (circles, ellipses, etc.)
- Solution Types for Conic Intersections Circle-Ellipse Intersections can have:
- No solutions (no intersection points)
- One solution (curves are tangent)
- Two solutions (curves intersect twice)
- Three solutions (curves intersect three times)
- Four solutions (curves intersect four times)
- Strategy
- Look for like terms between equations
- Multiply equations to match coefficients
- Add/subtract to eliminate one variable
- Solve resulting single-variable equation
- Back-substitute to find other variable
- Key Considerations
- Don’t need to recognize curve types to solve
- Pay extra attention to algebra if curves unfamiliar
- Watch for extraneous solutions
- Check all solutions in both equations
You can view the transcript for “Ex 3: Solve a System of Nonlinear Equations (Elimination)” here (opens in new window).
Graphing Inequalities
The Main Idea
- Universal Steps for Inequality Graphing
- Convert inequality to equation by replacing inequality symbol
- Graph boundary line/curve
- Use solid line for [latex]\leq[/latex] or [latex]\geq[/latex]
- Use dashed line for [latex]\lt[/latex] or [latex]\gt[/latex]
- Test point to determine shading region
- Shade solution region
- Boundary Line Types
- Linear: [latex]ax + by \leq c[/latex]
- Parabolic: [latex]y \leq ax^2 + bx + c[/latex]
- Circle: [latex]x^2 + y^2 \leq r^2[/latex]
- Other nonlinear curves
- Region Testing Strategy
- Choose point NOT on boundary
- Pick simple point (like [latex](0,0)[/latex])
- Test in original inequality
- If true, shade that region
- If false, shade opposite region
- Visual Indicators
- Solid line: includes boundary points
- Dashed line: excludes boundary points
- Shaded region: all solution points
- Multiple regions possible with systems
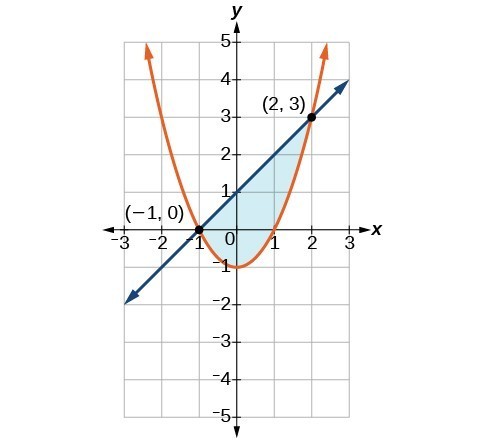
Graphing a System of Nonlinear Inequalities
The Main Idea
- System Components
- At least one nonlinear inequality
- Two or more inequalities
- Solution is intersection of regions
- Feasible region where all inequalities are satisfied
- Solution Process
- Find intersection points algebraically
- Graph boundary curves
- Test regions for each inequality
- Identify overlapping solution region
- Types of Boundaries
- Parabolas: [latex]y \leq ax^2 + bx + c[/latex]
- Circles: [latex]x^2 + y^2 \leq r^2[/latex]
- Other conics (ellipses, hyperbolas)
- Mix of linear and nonlinear
- Region Analysis
- May have multiple solution regions
- Regions can be bounded/unbounded
- Some regions may be disconnected
- Check entire boundary for intersections
[latex]\begin{gathered}y\ge {x}^{2}-1 \\ x-y\ge -1 \end{gathered}[/latex]
You can view the transcript for “Graph the Solution to a System of Inequalities. (Quadratic/Linear) Bounded” here (opens in new window).
You can view the transcript for “Graph the Solution to a System of Inequalities. (Quadratic/Linear) No Solution” here (opens in new window).