Graphing Inequalities
All of the equations in the systems that we have encountered so far have involved equalities, but we may also encounter systems that involve inequalities.
So, how do you get from the algebraic form of an inequality to a graph of that inequality?
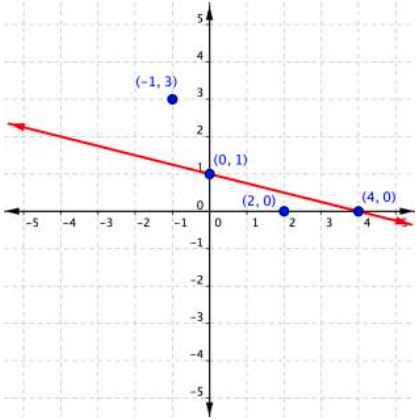
- Start by converting the inequality to an equation by replacing the inequality sign with an equal sign.
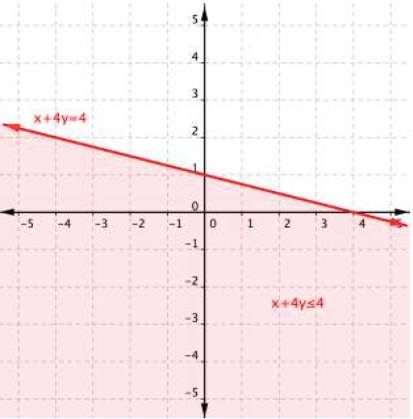
- Plot the equation on a coordinate plane. The line/curve will serve as the boundary for your inequality.
- The line/curve is solid if the inequality includes [latex]\geq[/latex] or [latex]\leq[/latex].
- The line/curve is dahsed if the inequality includes [latex]\gt[/latex] or [latex]\lt[/latex].
- Choose a test point that is not on the line to determine which side of the line/curve satisfies the inequality.
- Shade the area of the graph where the inequality is true. This is the solution region.
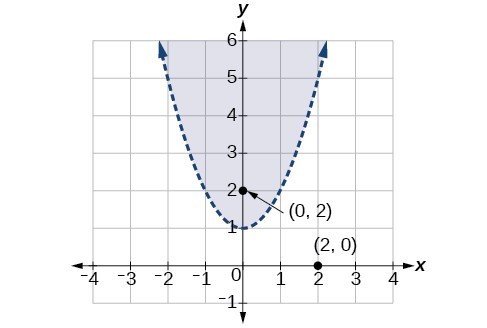
Now we will follow similar steps to graph a nonlinear inequality so that we can learn to solve systems of nonlinear inequalities. A nonlinear inequality is an inequality containing a nonlinear expression. Graphing a nonlinear inequality is much like graphing a linear inequality.
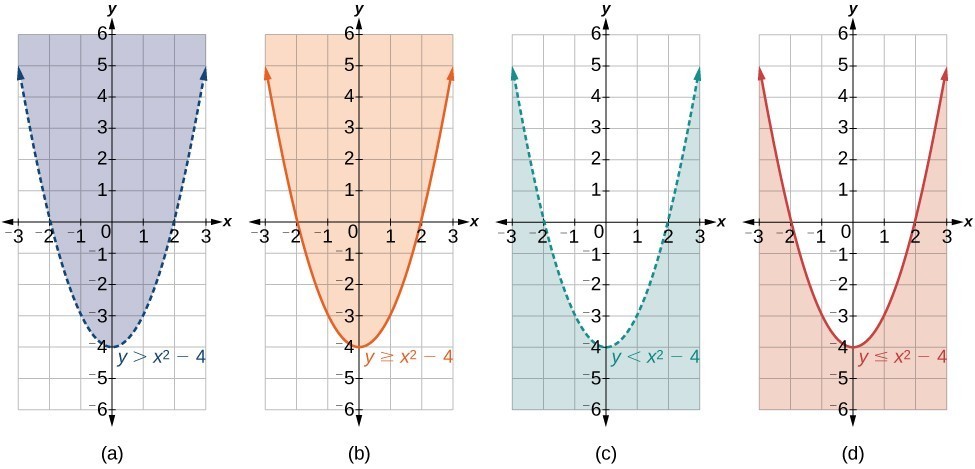
Recall that when the inequality is strictly greater than, [latex]y>a[/latex], or less than, [latex]y < a,\text{}[/latex] the graph is drawn with a dashed line. When the inequality is greater than or equal to, [latex]y\ge a,\text{}[/latex] or less than or equal to, [latex]y\le a,\text{}[/latex] the graph is drawn with a solid line. The graphs will create regions in the plane, and we will test each region for a solution. If one point in the region works, the whole region works. That is the region we shade.
- Graph the parabola as if it were an equation. This is the boundary for the region that is the solution set.
- If the boundary is included in the region (the operator is [latex]\le[/latex] or [latex]\ge[/latex] ), the parabola is graphed as a solid line.
- If the boundary is not included in the region (the operator is < or >), the parabola is graphed as a dashed line.
- Test a point in one of the regions to determine whether it satisfies the inequality statement. If the statement is true, the solution set is the region including the point. If the statement is false, the solution set is the region on the other side of the boundary line.
- Shade the region representing the solution set.