Graphing Transformations of Logarithmic Functions
Transformations of logarithmic graphs behave similarly to those of other parent functions. We can shift, stretch, compress, and reflect the parent function [latex]y={\mathrm{log}}_{b}\left(x\right)[/latex] without loss of shape.
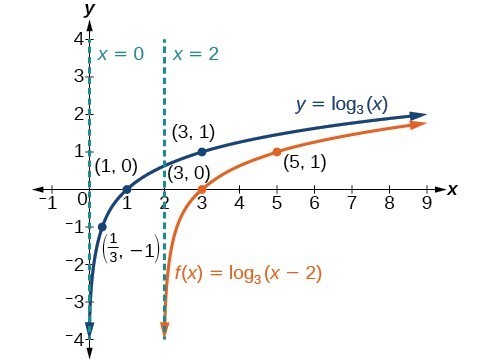
Graphing a Horizontal Shift of [latex]f\left(x\right)={\mathrm{log}}_{b}\left(x\right)[/latex]
When a constant [latex]c[/latex] is added to the input of the parent function [latex]f\left(x\right)=\text{log}_{b}\left(x\right)[/latex], the result is a horizontal shift [latex]c[/latex] units in the opposite direction of the sign on [latex]c[/latex].
To visualize horizontal shifts, we can observe the general graph of the parent function [latex]f\left(x\right)={\mathrm{log}}_{b}\left(x\right)[/latex] alongside the shift left, [latex]g\left(x\right)={\mathrm{log}}_{b}\left(x+c\right)[/latex], and the shift right, [latex]h\left(x\right)={\mathrm{log}}_{b}\left(x-c\right)[/latex] where [latex]c > 0[/latex].
- Adjust the [latex]c[/latex] value to [latex]4[/latex].
- Which direction does the graph of [latex]g(x)[/latex] shift? What is the vertical asymptote, [latex]x[/latex]-intercept, and equation for this new function? How do the domain and range change?
- Which direction does the graph of [latex]h(x)[/latex] shift? What is the vertical asymptote, [latex]x[/latex]-intercept, and equation for this new function? How do the domain and range change?
The graphs below summarize the changes in the [latex]x[/latex]-intercepts, vertical asymptotes, and equations of a logarithmic function that has been shifted either right or left.
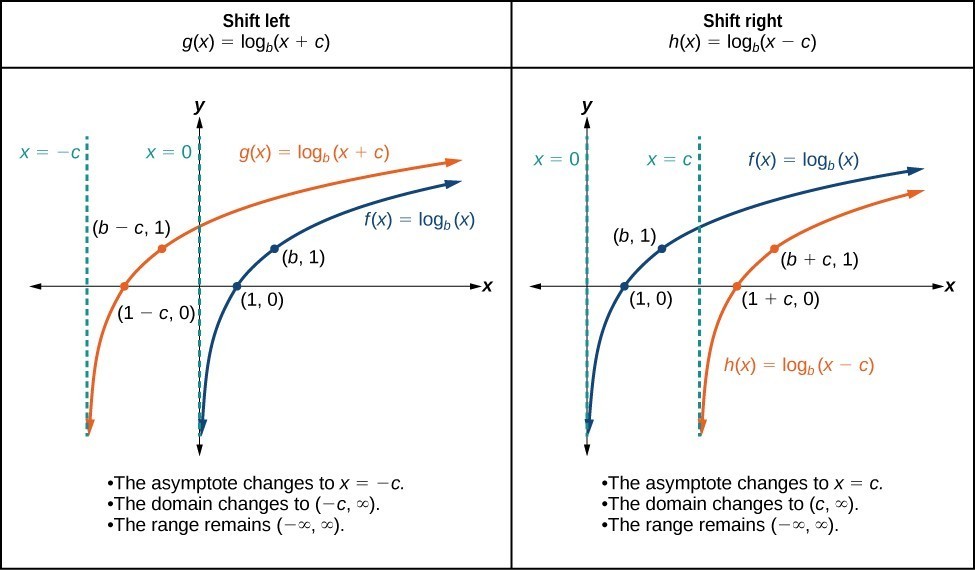
horizontal shifts of the parent function [latex]y=\text{log}_{b}\left(x\right)[/latex]
For any constant [latex]c[/latex], the function [latex]f\left(x\right)={\mathrm{log}}_{b}\left(x+c\right)[/latex]
- shifts the parent function [latex]y={\mathrm{log}}_{b}\left(x\right)[/latex] left [latex]c[/latex] units if [latex]c > 0[/latex].
- shifts the parent function [latex]y={\mathrm{log}}_{b}\left(x\right)[/latex] right [latex]c[/latex] units if [latex]c < 0[/latex].
- has the vertical asymptote [latex]x = –c[/latex].
- has domain [latex]\left(-c,\infty \right)[/latex].
- has range [latex]\left(-\infty ,\infty \right)[/latex].
- Identify the horizontal shift:
- If [latex]c > 0[/latex], shift the graph of [latex]f\left(x\right)={\mathrm{log}}_{b}\left(x\right)[/latex] left [latex]c[/latex] units.
- If [latex]c < 0[/latex], shift the graph of [latex]f\left(x\right)={\mathrm{log}}_{b}\left(x\right)[/latex] right [latex]c[/latex] units.
- Draw the vertical asymptote [latex]x = –c[/latex].
- Identify three key points from the parent function. Find new coordinates for the shifted functions by subtracting [latex]c[/latex] from the [latex]x[/latex] coordinate in each point.
- Label the three points.
- The domain is [latex]\left(-c,\infty \right)[/latex], the range is [latex]\left(-\infty ,\infty \right)[/latex], and the vertical asymptote is [latex]x = –c[/latex].
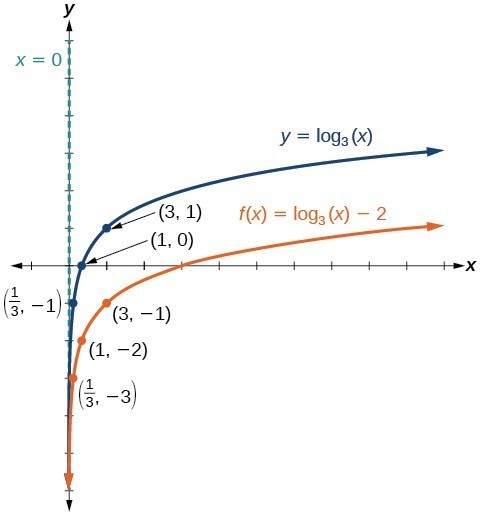
Graphing a Vertical Shift of [latex]y=\text{log}_{b}\left(x\right)[/latex]
When a constant [latex]d[/latex] is added to the parent function [latex]f\left(x\right)={\mathrm{log}}_{b}\left(x\right)[/latex], the result is a vertical shift [latex]d[/latex] units in the direction of the sign of [latex]d[/latex]. To visualize vertical shifts, we can observe the general graph of the parent function [latex]f\left(x\right)={\mathrm{log}}_{b}\left(x\right)[/latex] alongside the shift up, [latex]g\left(x\right)={\mathrm{log}}_{b}\left(x\right)+d[/latex], and the shift down, [latex]h\left(x\right)={\mathrm{log}}_{b}\left(x\right)-d[/latex].
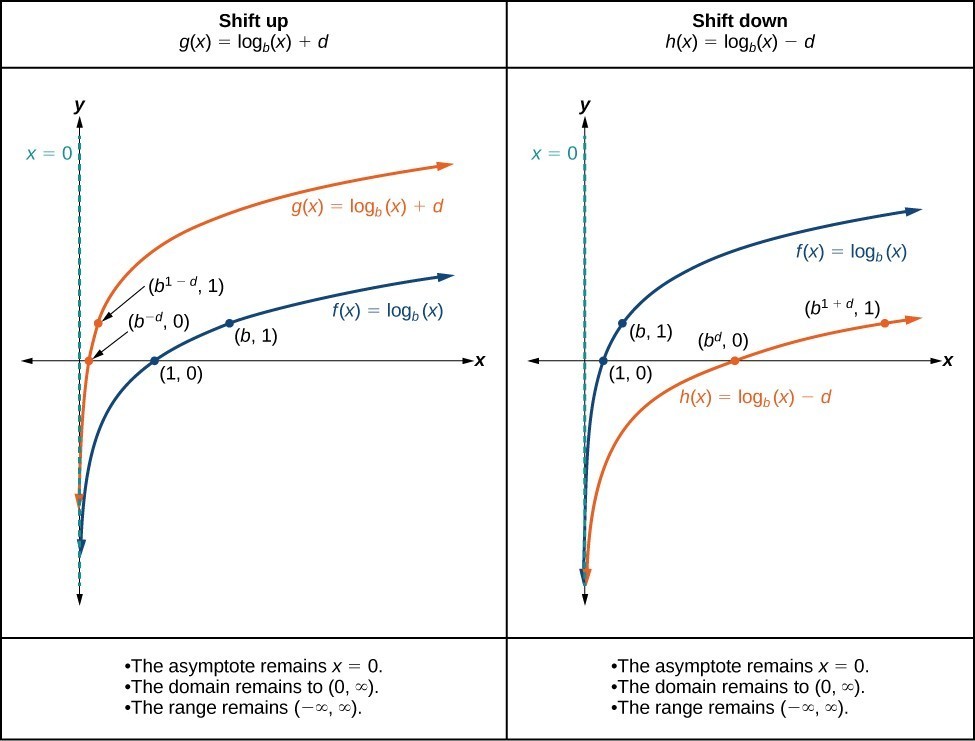
vertical shifts of the parent function [latex]y=\text{log}_{b}\left(x\right)[/latex]
For any constant [latex]d[/latex], the function [latex]f\left(x\right)={\mathrm{log}}_{b}\left(x\right)+d[/latex]
- shifts the parent function [latex]y={\mathrm{log}}_{b}\left(x\right)[/latex] up [latex]d[/latex] units if [latex]d > 0[/latex].
- shifts the parent function [latex]y={\mathrm{log}}_{b}\left(x\right)[/latex] down [latex]d[/latex] units if [latex]d < 0[/latex].
- has the vertical asymptote [latex]x = 0[/latex].
- has domain [latex]\left(0,\infty \right)[/latex].
- has range [latex]\left(-\infty ,\infty \right)[/latex].
- Identify the vertical shift:
- If [latex]d > 0[/latex], shift the graph of [latex]f\left(x\right)={\mathrm{log}}_{b}\left(x\right)[/latex] up [latex]d[/latex] units.
- If [latex]d < 0[/latex], shift the graph of [latex]f\left(x\right)={\mathrm{log}}_{b}\left(x\right)[/latex] down [latex]d[/latex]units.
- Draw the vertical asymptote [latex]x = 0[/latex].
- Identify three key points from the parent function. Find new coordinates for the shifted functions by adding [latex]d[/latex] to the [latex]y[/latex]coordinate of each point.
- Label the three points.
- The domain is [latex]\left(0,\infty \right)[/latex], the range is [latex]\left(-\infty ,\infty \right)[/latex], and the vertical asymptote is [latex]x = 0[/latex].