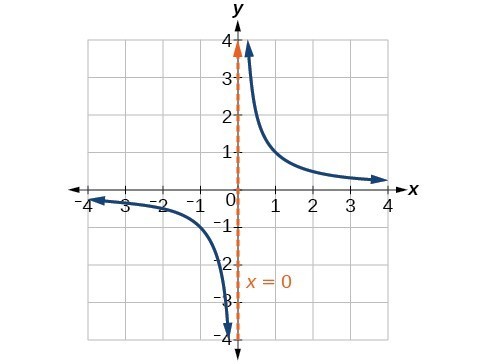
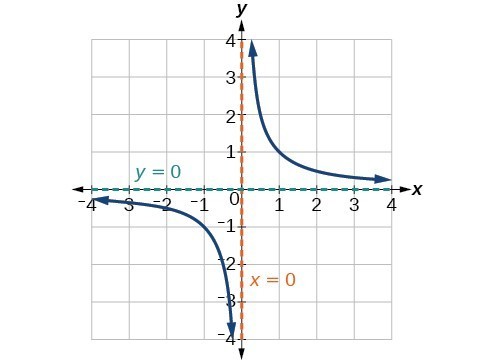
Local Behavior of [latex]f\left(x\right)=\frac{1}{x}[/latex]
Consider the function [latex]f(x) = \dfrac{1}{x}[/latex].
Previously, we state that:
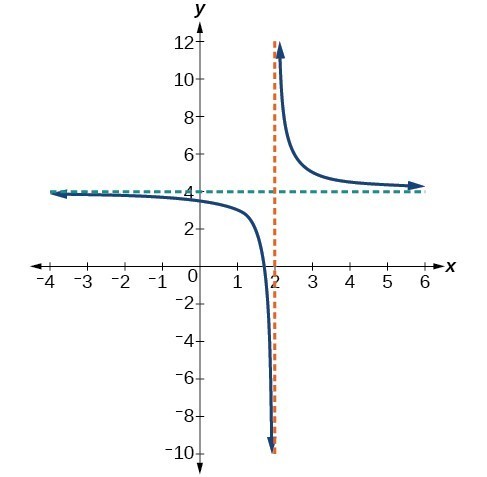
- As [latex]x\to {0}^{-}, f\left(x\right)\to -\infty[/latex]
- As [latex]x\to {0}^{+}, f\left(x\right)\to \infty[/latex].
This behavior creates a vertical asymptote, which is a vertical line that the graph approaches but never crosses. In this case, as the input nears zero from the left, the function value decreases without bound. As the input nears zero from the right, the function value increases without bound. The line [latex]x=0[/latex] is a vertical asymptote for the function.
vertical asymptote
A vertical asymptote of a graph is a vertical line [latex]x=a[/latex] where the graph tends toward positive or negative infinity as the inputs approach [latex]x[/latex].
We write:
[latex]\text{As }x\to a,f\left(x\right)\to \infty , \text{or as }x\to a,f\left(x\right)\to -\infty[/latex]
a, meaning not
sun, meaning together
ptotos, meaning to fall
These give us asymptotos, meaning not falling together, which leads to the modern term describing a line that a curve (the graph of a function) approaches but never meets.
End Behavior of [latex]f\left(x\right)=\frac{1}{x}[/latex]
Let’s take a look at the end behavior of the function [latex]f(x) = \dfrac{1}{x}[/latex] again.
As the values of [latex]x[/latex] approach infinity, the function values approach [latex]0[/latex]. As the values of [latex]x[/latex] approach negative infinity, the function values approach [latex]0[/latex]. Symbolically, using arrow notation
[latex]\text{As }x\to \infty ,f\left(x\right)\to 0,\text{and as }x\to -\infty ,f\left(x\right)\to 0[/latex].
Based on this overall behavior and the graph, we can see that the function approaches [latex]0[/latex] but never actually reaches [latex]0[/latex]; it seems to level off as the inputs become large. This behavior creates a horizontal asymptote, a horizontal line that the graph approaches as the input increases or decreases without bound. In this case, the graph is approaching the horizontal line [latex]y=0[/latex].
horizontal asymptote
A horizontal asymptote of a graph is a horizontal line [latex]y=b[/latex] where the graph approaches the line as the inputs increase or decrease without bound.
We write
[latex]\text{As }x\to \infty \text{ or }x\to -\infty ,\text{ }f\left(x\right)\to b[/latex].