Using a Given Intercept to Build a Model
Some real-world problems provide the [latex]y[/latex]-intercept, which is the constant or initial value. Once the [latex]y[/latex]-intercept is known, the [latex]x[/latex]-intercept can be calculated.
Let’s explore this through an example.
[latex]\\[/latex]
The [latex]y[/latex]-intercept is the initial amount of her debt, or [latex]$1,000[/latex]. The rate of change, or slope, is [latex]–$250[/latex] per month. We can then use slope-intercept form and the given information to develop a linear model.
[latex]\begin{array}{l}f\left(x\right)=mx+b\hfill \\ f\left(x\right)=-250x+1000\hfill \end{array}[/latex]
Now we can set the function equal to [latex]0[/latex] and solve for [latex]x[/latex] to find the [latex]x[/latex]-intercept.
[latex]\begin{array}{l}0=-250x+1000\hfill \\ 1000=250x\hfill \\ 4=x\hfill \\ x=4\hfill \end{array}[/latex]
The [latex]x[/latex]-intercept is the number of months it takes her to reach a balance of [latex]$0[/latex]. The [latex]x[/latex]-intercept is [latex]4[/latex] months, so it will take Hannah four months to pay off her loan.
Using a Given Input and Output to Build a Model
Many real-world applications are not as direct as the ones we just considered. Instead they require us to identify some aspect of a linear function. We might sometimes be asked to evaluate the linear model at a given input or set the equation of the linear model equal to a specified output.
- Identify the input and output values.
- Convert the data to two coordinate pairs.
- Find the slope.
- Write the linear model.
- Use the model to make a prediction by evaluating the function at a given [latex]x[/latex] value.
- Use the model to identify an [latex]x[/latex] value that results in a given [latex]y[/latex] value.
- Answer the question posed.
- Predict the population in 2013.
- Identify the year in which the population will reach [latex]15,000[/latex].
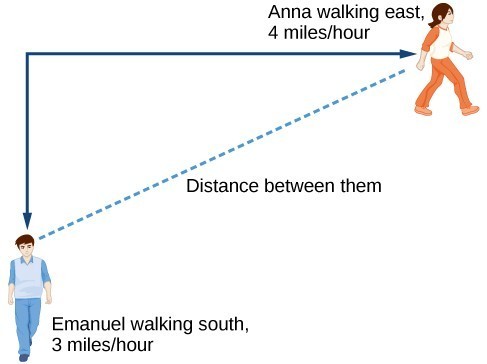
Using a Diagram to Model a Problem
It is useful for many real-world applications to draw a picture to gain a sense of how the variables representing the input and output may be used to answer a question. To draw the picture, first consider what the problem is asking for. Then, determine the input and the output. The diagram should relate the variables. Often, geometric shapes or figures are drawn. Distances are often traced out. If a right triangle is sketched, the Pythagorean Theorem relates the sides. If a rectangle is sketched, labeling width and height is helpful.
[latex]\\[/latex]
How long after they start walking will they fall out of radio contact?
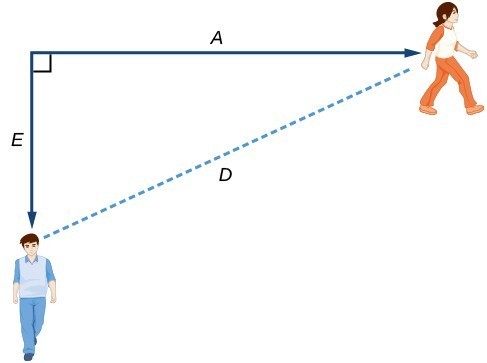
Yes. Sketch the figure and label the quantities and unknowns on the sketch.
[latex]\\[/latex]
If the town of Eastborough is located [latex]20[/latex] miles directly east of the town of Westborough, how far is the road junction from Westborough?
